
Cell-type prediction with GDR
Cell type prediction by GDR
In this tutorial, we use a reference dataset to predict the cell type annotations of the query dataset. The cell type annotations of the query dataset are known, therefore our predictions can be verified and checked for accuracy.
import numpy as npimport pandas as pdimport scanpy as scimport matplotlib.pyplot as pltfrom sklearn import metricsimport seaborn as snsimport loggingfrom matplotlib import rcParamsimport sysfrom sklearn.metrics import f1_scoreimport warningswarnings.simplefilter(action='ignore', category=FutureWarning)# To modify the default figure size, use rcParams.piaso.settings.set_figure_params(style="cell")rcParams['figure.figsize'] = 5, 5rcParams['font.sans-serif'] = "Arial"rcParams['font.family'] = "Arial"sc.settings.verbosity = 3sc.logging.print_header()import piasoLoad the data
Load the reference dataset
We will use the 20k subsampled version of the Seattle Alzheimer’s Disease Brain Cell Atlas (SEA-AD) project dataset described in detail in Gabitto et. al. (2024), as the reference dataset. We will be using the scRNA-seq data from the dataset in this tutorial. Please refer to the Introduction tutorial to learn more about how it was preprocessed and normalized.
Download the subsampled, pre-processed dataset from Google Drive: https://drive.google.com/file/d/1pDBIgPvEO-sBuIMEhrvVhnf7tfU7H6Xy/view?usp=drive_link
The original data is available on https://portal.brain-map.org/explore/seattle-alzheimers-disease
# Download from Google Drive:# Reference: https://drive.google.com/file/d/1pDBIgPvEO-sBuIMEhrvVhnf7tfU7H6Xy/viewdata_dir = "." # Update to your download directoryref_adata = sc.read(data_dir + '/SEA-AD_RNA_MTG_subsample_excludeReference_20k_piaso_preprocessed.h5ad')ref_adataLoad the query dataset
We will use a pre-processed Great Apes RNASeq data, particularly the human data subset as the query dataset for predicting cell types in this tutorial.
Download the dataset from: https://drive.google.com/file/d/1nF0iRTGFFQcEcM6hYcPptiYkxs65k2p4/view?usp=drive_link
# Download from Google Drive:# https://drive.google.com/file/d/1nF0iRTGFFQcEcM6hYcPptiYkxs65k2p4/viewaibs_query_adata = sc.read(data_dir + "/GreatApesMTG_RNA_integrated_raw_onlyOrthogonal_gdr_humanSubset_aibs.h5ad")aibs_query_adataVisualize with UMAPs
Reorder the query dataset categories to match the reference dataset categories
categories = ['Astrocyte', 'Chandelier', 'Endothelial', 'L2/3 IT', 'L4 IT', 'L5 ET', 'L5 IT', 'L5/6 NP', 'L6 CT', 'L6 IT', 'L6 IT Car3', 'L6b', 'Lamp5', 'Lamp5 Lhx6', 'Microglia-PVM', 'OPC', 'Oligodendrocyte', 'Pax6', 'Pvalb', 'Sncg', 'Sst', 'Sst Chodl', 'VLMC', 'Vip']aibs_query_adata.obs['subclass'] = aibs_query_adata.obs['subclass'].cat.rename_categories(categories)aibs_query_adata.obs['subclass']=aibs_query_adata.obs['subclass'].astype('category')aibs_query_adata.obs['subclass']=aibs_query_adata.obs['subclass'].cat.reorder_categories(ref_adata.obs['Subclass'].cat.categories)sc.pl.umap(ref_adata, color=['Subclass'], palette=piaso.pl.color.d_color4, ncols=1, size=10, frameon=True)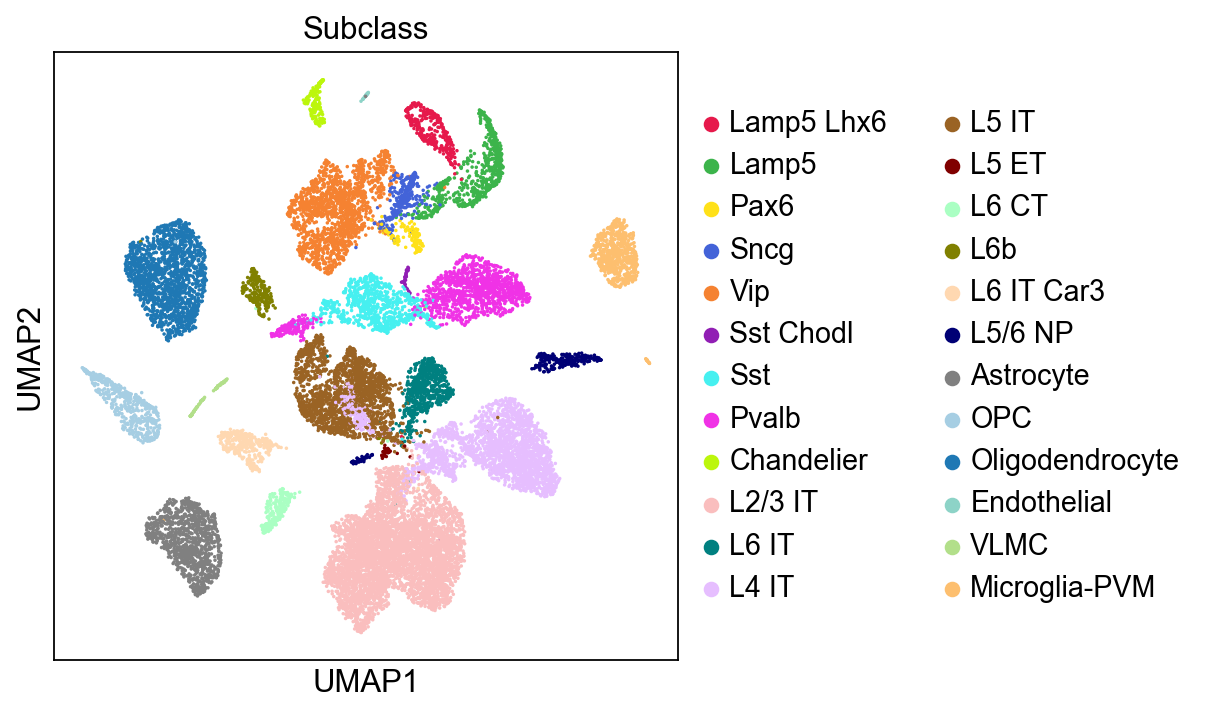
sc.pl.umap(aibs_query_adata, color=['subclass'], palette=piaso.pl.color.d_color4, ncols=1, size=10, frameon=True)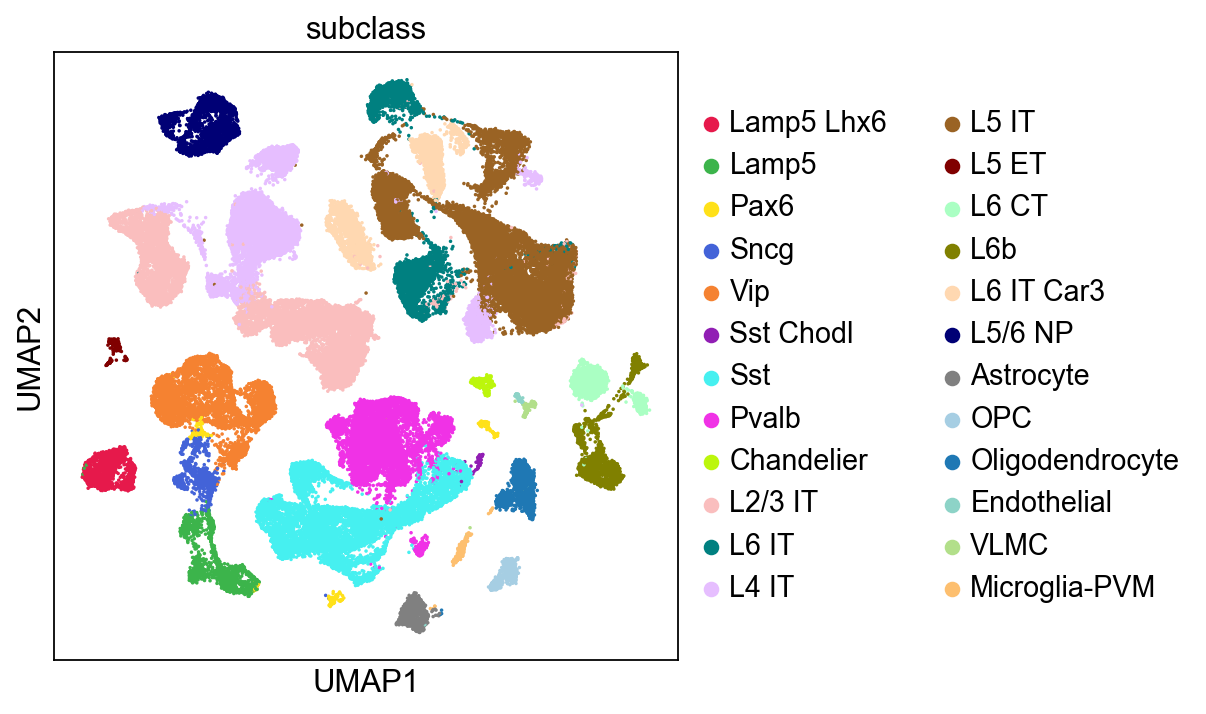
Cluster the query data
%%timesc.tl.leiden(aibs_query_adata,resolution=0.2,key_added='Leiden',flavor="igraph",n_iterations=-1)logging.getLogger('matplotlib.font_manager').disabled = Truesc.pl.umap(aibs_query_adata, color=['Leiden'], palette=piaso.pl.color.d_color4, legend_fontsize=12, legend_fontoutline=2, legend_loc='on data', ncols=1, size=10, frameon=False)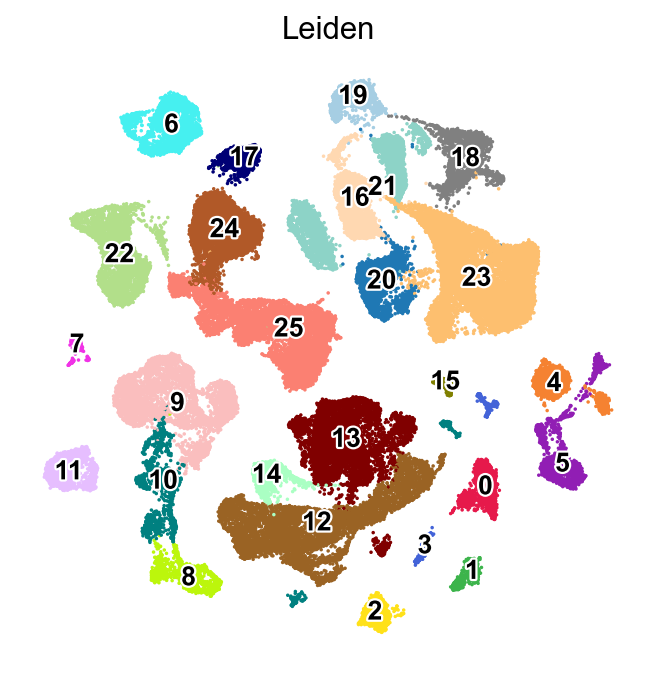
Predict cell types by GDR
piaso.tl.predictCellTypeByGDR( aibs_query_adata, ref_adata, layer = 'log1p', layer_reference = 'log1p', reference_groupby = 'Subclass', query_groupby = 'Leiden', mu = 10.0, n_genes= 15, return_integration = False, use_highly_variable = True, n_highly_variable_genes = 5000, n_svd_dims = 50, resolution= 1.0, scoring_method= None, key_added= None, verbosity= 0,)Reorder the query dataset categories to match the reference dataset categories
aibs_query_adata.obs['CellTypes_gdr']=aibs_query_adata.obs['CellTypes_gdr'].astype('category')aibs_query_adata.obs['CellTypes_gdr']=aibs_query_adata.obs['CellTypes_gdr'].cat.reorder_categories(aibs_query_adata.obs['subclass'].cat.categories)We can now visualize the predicted cell types from GDR using a UMAP and compare them with the UMAP of the true cell types.
sc.pl.embedding(aibs_query_adata, basis='X_umap', color=['CellTypes_gdr', 'subclass'], palette=piaso.pl.color.d_color4, cmap=piaso.pl.color.c_color3, ncols=1, size=10, frameon=False)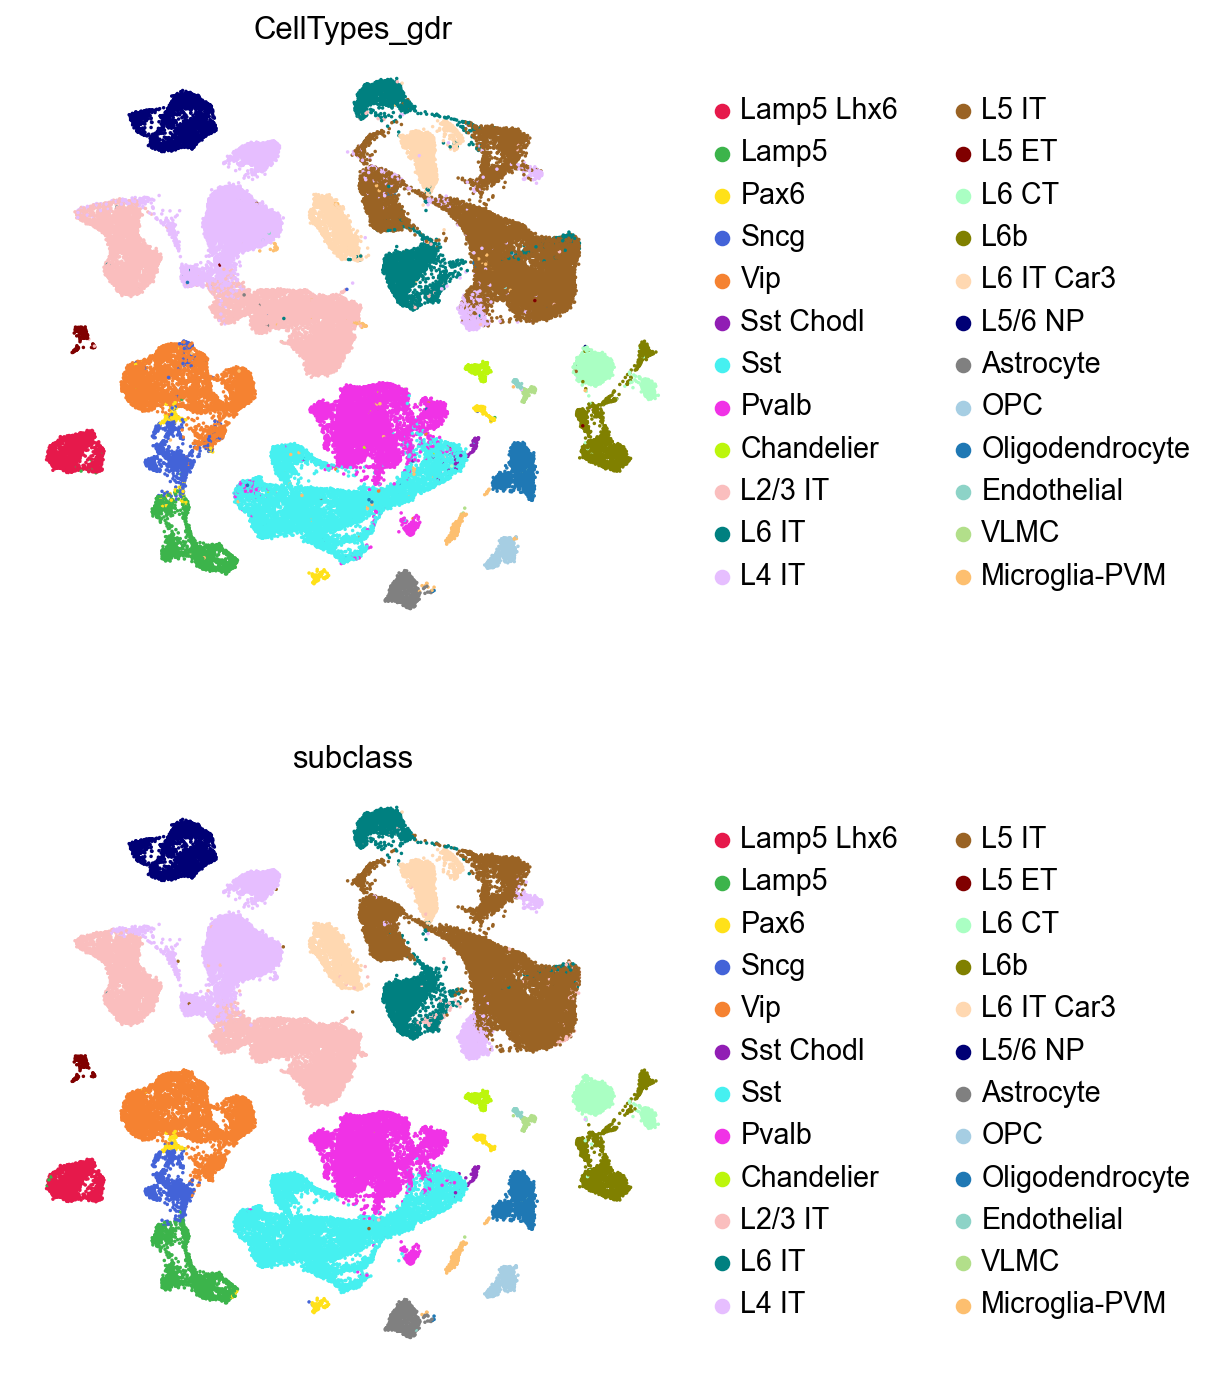
Since we know the real subclass of the test data, we can test the performance of predictCellTypeByGDR by comparing predicted celltypes and true subclasses.
confusion_matrix = metrics.confusion_matrix(aibs_query_adata.obs['subclass'].values, aibs_query_adata.obs['CellTypes_gdr'].values)confusion_matrix_df = pd.DataFrame(confusion_matrix, columns=aibs_query_adata.obs['subclass'].cat.categories, index=aibs_query_adata.obs['subclass'].cat.categories)normalized_cf_matrix_df = confusion_matrix_df/confusion_matrix_df.sum(axis=0)sns.set_style("whitegrid", {'axes.grid' : False})sns.set(rc={'figure.figsize':(8, 6)})sns.heatmap(normalized_cf_matrix_df, cmap="Purples", xticklabels=True, yticklabels=True)plt.xlabel("Predicted Subclass")plt.ylabel("True Subclass")plt.show()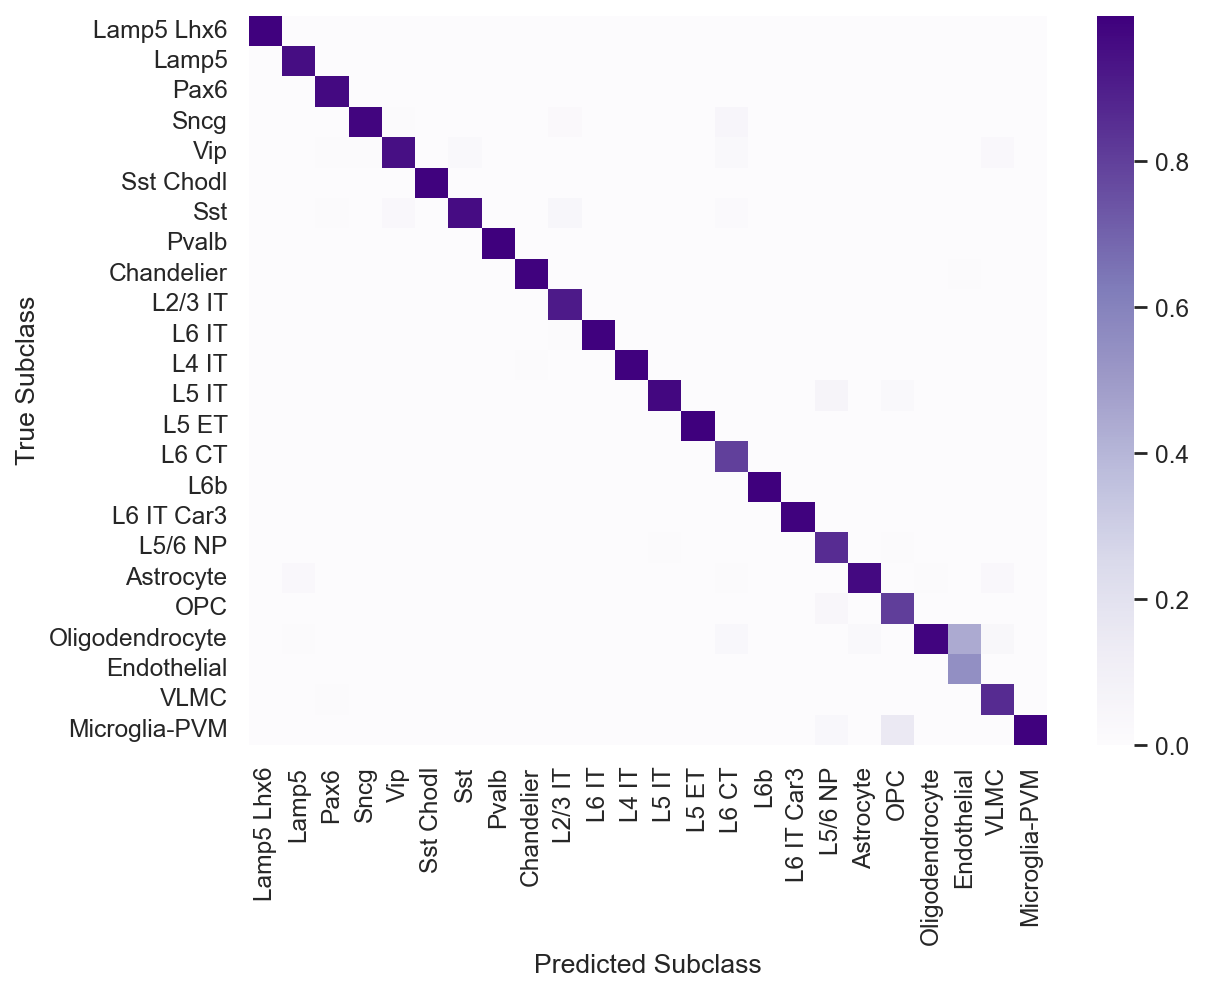
piaso_f1_score=np.round(f1_score(aibs_query_adata.obs['subclass'], aibs_query_adata.obs['CellTypes_gdr'], average='micro'), decimals=3)print(f"The Micro F1 score for PIASO prediction: {piaso_f1_score}")piaso_f1_score=np.round(f1_score(aibs_query_adata.obs['subclass'], aibs_query_adata.obs['CellTypes_gdr'], average='macro'), decimals=3)print(f"The Macro F1 score for PIASO prediction: {piaso_f1_score}")