
Pre-processing CellRanger outputs (single sample, Human PBMCs)
Pre-processing CellRanger outputs (single sample, Human PBMCs)
import piasoimport cosgimport numpy as npimport pandas as pdimport scanpy as scimport loggingfrom sklearn.preprocessing import StandardScalerimport warnings
from matplotlib import rcParamssc.settings.set_figure_params(scanpy=True, dpi=80, dpi_save=300, frameon=True, vector_friendly=False, fontsize=14)import matplotlib as mplmpl.rcParams['pdf.fonttype'] = 42mpl.rcParams['ps.fonttype'] = 42.../site-packages/tqdm/auto.py:21: TqdmWarning: IProgress not found. Please update jupyter and ipywidgets. See https://ipywidgets.readthedocs.io/en/stable/user_install.html from .autonotebook import tqdm as notebook_tqdmdata_dir = ".../Data/Public/PBMCMultiomeRop2023"save_dir = ".../Results/single-cell/Methods/DataProcessing/PBMCMultiomeRop2023"prefix = "HumanPBMCs_Multiome_RNA"# !.../gdrive files download --destination .../Data/Public/PBMCMultiomeRop2023 1g1V-VTy2qHK7PJIbW-t9hRFzHCqFCe4Tdata_path = data_dir + "/filtered_feature_bc_matrix.h5"adata=sc.read_10x_h5(data_path)adata.../site-packages/anndata/_core/anndata.py:1758: UserWarning: Variable names are not unique. To make them unique, call `.var_names_make_unique`. utils.warn_names_duplicates("var").../site-packages/anndata/_core/anndata.py:1758: UserWarning: Variable names are not unique. To make them unique, call `.var_names_make_unique`. utils.warn_names_duplicates("var")AnnData object with n_obs × n_vars = 4360 × 36601 var: 'gene_ids', 'feature_types', 'genome', 'interval'adata.var_names_make_unique()adata.obs['Sample']="Human_PBMCs"adata.X.dataarray([ 2., 1., 1., ..., 43., 18., 56.], shape=(6669764,), dtype=float32)adata.layers['raw'] = adata.XadataAnnData object with n_obs × n_vars = 4360 × 36601 obs: 'Sample' var: 'gene_ids', 'feature_types', 'genome', 'interval' layers: 'raw'adata.varsc.pp.filter_cells(adata, min_genes=200)adata.var['mt'] = adata.var_names.str.startswith('MT-')sc.pp.calculate_qc_metrics(adata, qc_vars=['mt'], percent_top=None, log1p=False, inplace=True)adata.var['ribo'] = adata.var_names.str.startswith('RPS','RPL')sc.pp.calculate_qc_metrics(adata, qc_vars=['ribo'], percent_top=None, log1p=False, inplace=True)/tmp/ipykernel_842045/3834852883.py:1: FutureWarning: Allowing a non-bool 'na' in obj.str.startswith is deprecated and will raise in a future version. adata.var['ribo'] = adata.var_names.str.startswith('RPS','RPL')piaso.pl.plot_features_violin(adata, ['n_genes_by_counts', 'total_counts', 'pct_counts_mt','pct_counts_ribo'], width_single=2.0)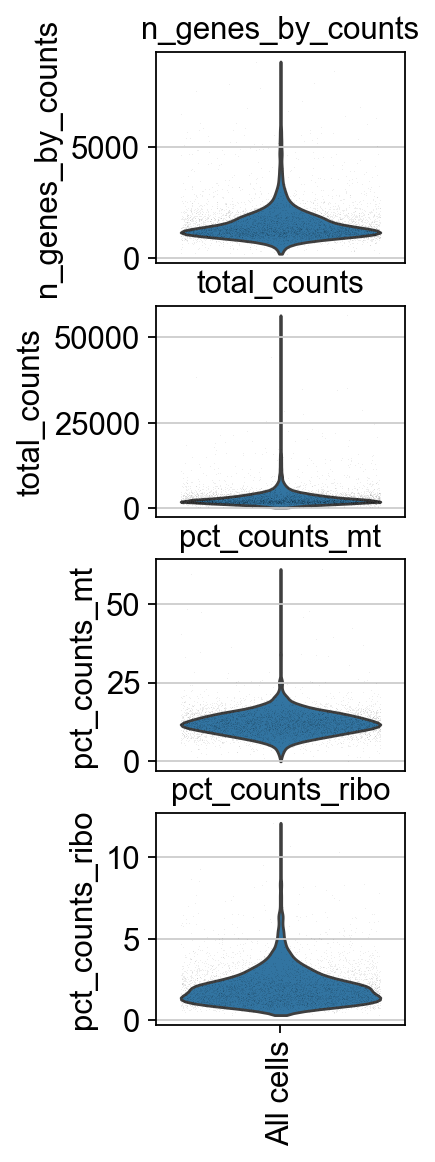
experiments=np.unique(adata.obs['Sample'])adata.obs['scrublet_score']=np.repeat(0,adata.n_obs)adata.obs['predicted_doublets']=np.repeat(False,adata.n_obs)import scrublet as scr
for experiment in experiments: print(experiment) adatai=adata[adata.obs['Sample']==experiment]
scrub = scr.Scrublet(adatai.X.todense(),random_state=10) doublet_scores, predicted_doublets = scrub.scrub_doublets()
adata.obs['predicted_doublets'][adatai.obs_names]=predicted_doublets
adata.obs['scrublet_score'][adatai.obs_names]=doublet_scoresHuman_PBMCsPreprocessing...Simulating doublets...Embedding transcriptomes using PCA...Calculating doublet scores...Automatically set threshold at doublet score = 0.14Detected doublet rate = 17.0%Estimated detectable doublet fraction = 79.6%Overall doublet rate: Expected = 10.0% Estimated = 21.4%Elapsed time: 7.3 seconds/tmp/ipykernel_842045/3464195482.py:10: FutureWarning: ChainedAssignmentError: behaviour will change in pandas 3.0!You are setting values through chained assignment. Currently this works in certain cases, but when using Copy-on-Write (which will become the default behaviour in pandas 3.0) this will never work to update the original DataFrame or Series, because the intermediate object on which we are setting values will behave as a copy.A typical example is when you are setting values in a column of a DataFrame, like:
df["col"][row_indexer] = value
Use `df.loc[row_indexer, "col"] = values` instead, to perform the assignment in a single step and ensure this keeps updating the original `df`.
See the caveats in the documentation: https://pandas.pydata.org/pandas-docs/stable/user_guide/indexing.html#returning-a-view-versus-a-copy
adata.obs['predicted_doublets'][adatai.obs_names]=predicted_doublets/tmp/ipykernel_842045/3464195482.py:10: SettingWithCopyWarning:A value is trying to be set on a copy of a slice from a DataFrame
See the caveats in the documentation: https://pandas.pydata.org/pandas-docs/stable/user_guide/indexing.html#returning-a-view-versus-a-copy adata.obs['predicted_doublets'][adatai.obs_names]=predicted_doublets/tmp/ipykernel_842045/3464195482.py:12: FutureWarning: ChainedAssignmentError: behaviour will change in pandas 3.0!You are setting values through chained assignment. Currently this works in certain cases, but when using Copy-on-Write (which will become the default behaviour in pandas 3.0) this will never work to update the original DataFrame or Series, because the intermediate object on which we are setting values will behave as a copy.A typical example is when you are setting values in a column of a DataFrame, like:
df["col"][row_indexer] = value
Use `df.loc[row_indexer, "col"] = values` instead, to perform the assignment in a single step and ensure this keeps updating the original `df`.
See the caveats in the documentation: https://pandas.pydata.org/pandas-docs/stable/user_guide/indexing.html#returning-a-view-versus-a-copy... [9 more lines]piaso.pl.plot_features_violin(adata, ['scrublet_score'], groupby='Sample', width_single=2)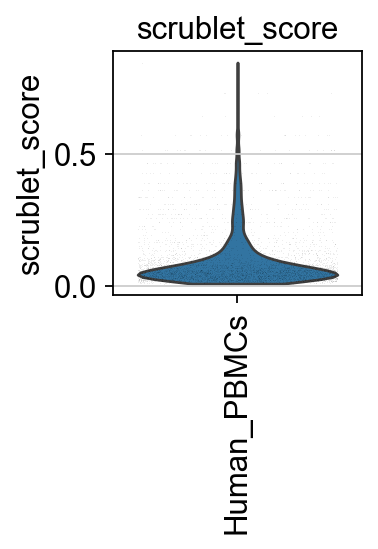
%%timesc.pp.normalize_total(adata, target_sum=1e4)sc.pp.log1p(adata)
adata.layers['log1p']=adata.X.copy()
CPU times: user 159 ms, sys: 14.2 ms, total: 173 msWall time: 143 ms%%timepiaso.tl.infog(adata, copy=False, inplace=False, n_top_genes=3000, key_added='infog', key_added_highly_variable_gene='highly_variable', layer='raw')The normalized data is saved as `infog` in `adata.layers`.The highly variable genes are saved as `highly_variable` in `adata.var`.Finished INFOG normalization.CPU times: user 434 ms, sys: 78.8 ms, total: 513 msWall time: 513 ms%%timepiaso.tl.runSVD(adata, use_highly_variable=True, n_components=30, random_state=10, key_added='X_svd', layer='infog')CPU times: user 2.95 s, sys: 3.4 ms, total: 2.95 sWall time: 477 ms%%timesc.pp.neighbors(adata, use_rep='X_svd', n_neighbors=15, random_state=10, knn=True, method="umap")
sc.tl.umap(adata)CPU times: user 26.6 s, sys: 107 ms, total: 26.7 sWall time: 24.5 ssc.pl.umap(adata, color=['n_genes_by_counts', 'total_counts','pct_counts_mt','pct_counts_ribo', 'scrublet_score'], cmap='Spectral_r', palette=piaso.pl.color.d_color1, ncols=2, size=10, frameon=False)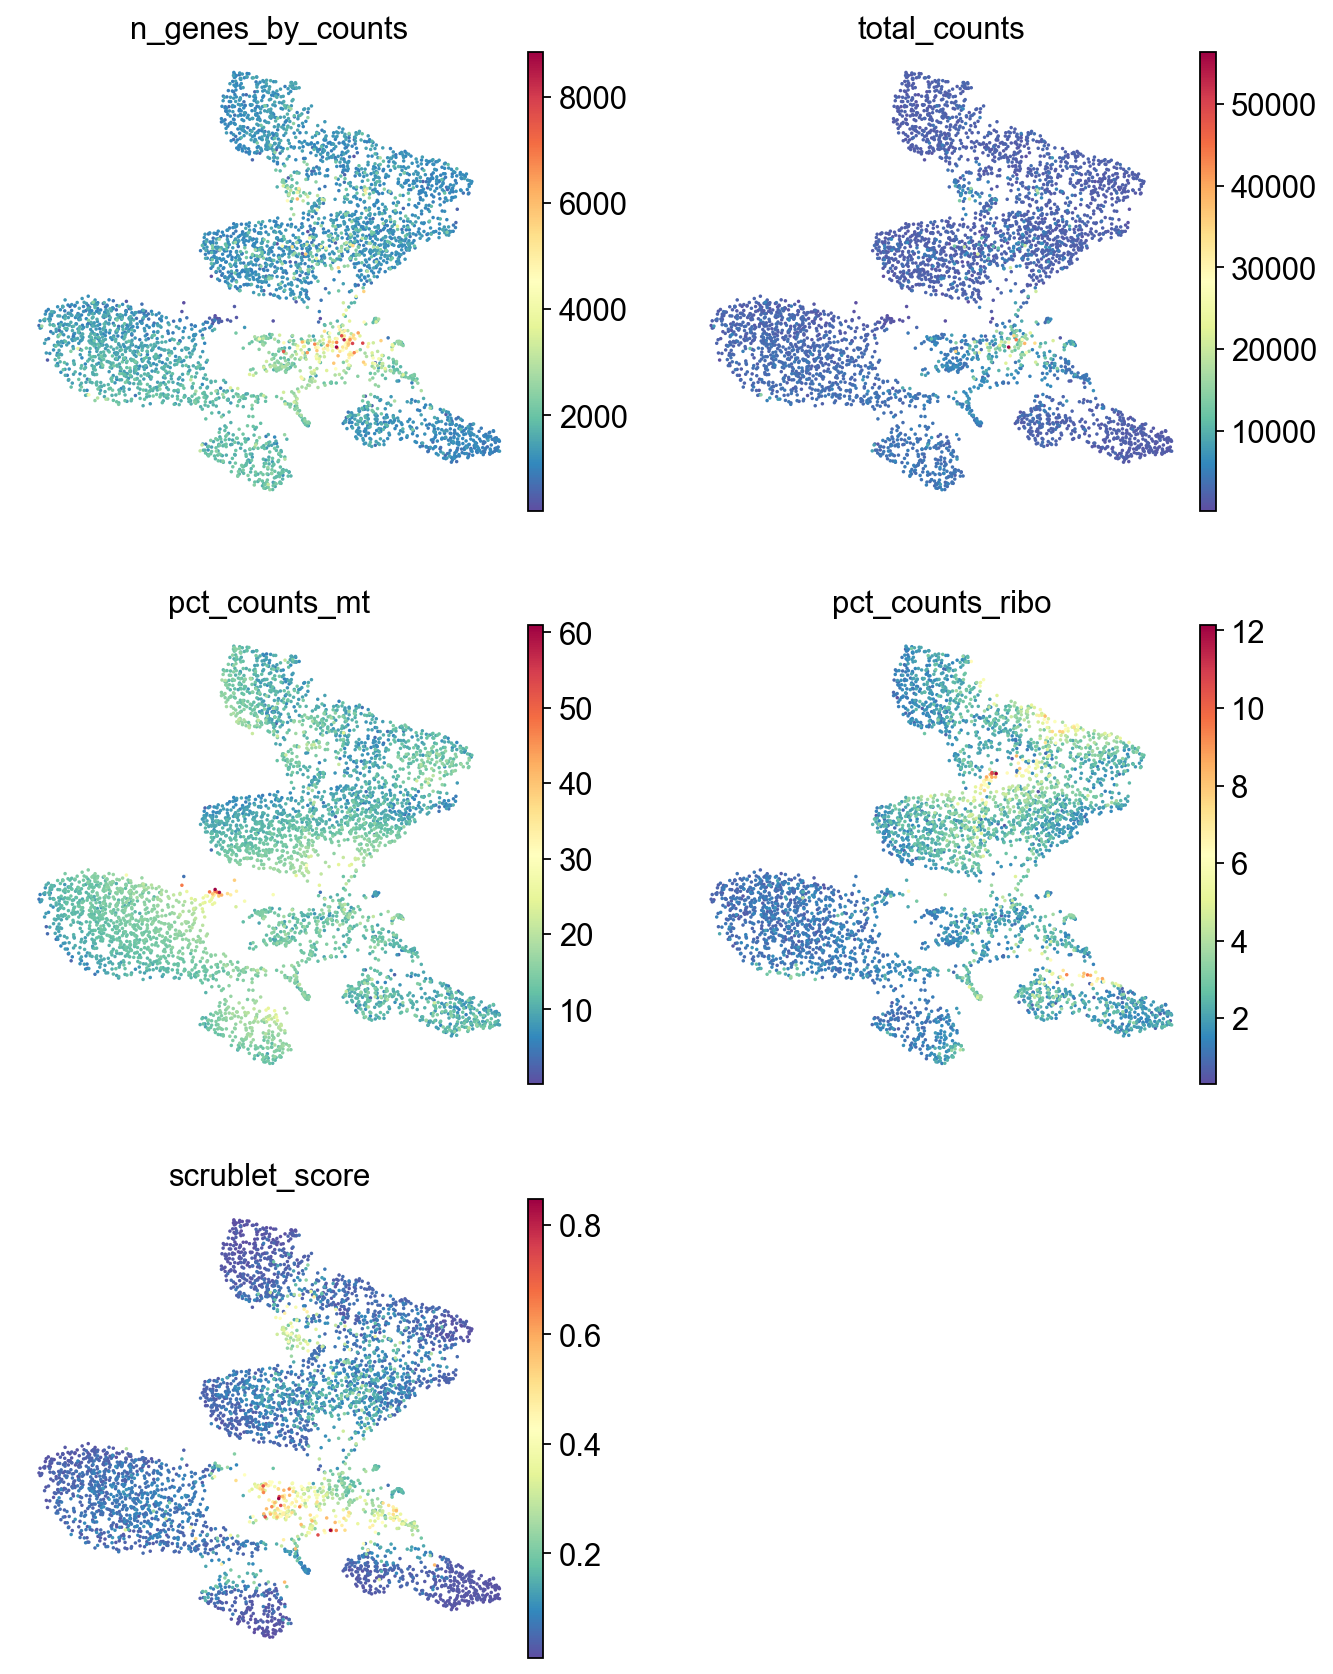
save_dir+'/'+prefix+'_raw_QC.h5ad''.../Results/single-cell/Methods/DataProcessing/PBMCMultiomeRop2023/HumanPBMCs_Multiome_RNA_raw_QC.h5ad'adata.write(save_dir+'/'+prefix+'_raw_QC.h5ad')# adata = sc.read(save_dir+'/'+prefix+'_raw_QC.h5ad')adata=adata[adata.obs['n_genes_by_counts']>500].copy()adata=adata[adata.obs['n_genes_by_counts']<10000].copy()adata = adata[adata.obs['scrublet_score']<0.3].copy()adataAnnData object with n_obs × n_vars = 3988 × 36601 obs: 'Sample', 'n_genes', 'n_genes_by_counts', 'total_counts', 'total_counts_mt', 'pct_counts_mt', 'total_counts_ribo', 'pct_counts_ribo', 'scrublet_score', 'predicted_doublets' var: 'gene_ids', 'feature_types', 'genome', 'interval', 'mt', 'n_cells_by_counts', 'mean_counts', 'pct_dropout_by_counts', 'total_counts', 'ribo', 'infog_var', 'highly_variable' uns: 'Sample_colors', 'log1p', 'neighbors', 'umap' obsm: 'X_svd', 'X_umap' layers: 'raw', 'log1p', 'infog' obsp: 'distances', 'connectivities'sc.pl.umap(adata, color=['n_genes_by_counts', 'total_counts','pct_counts_mt','pct_counts_ribo', 'scrublet_score'], cmap='Spectral_r', palette=piaso.pl.color.d_color1, ncols=2, size=10, frameon=False)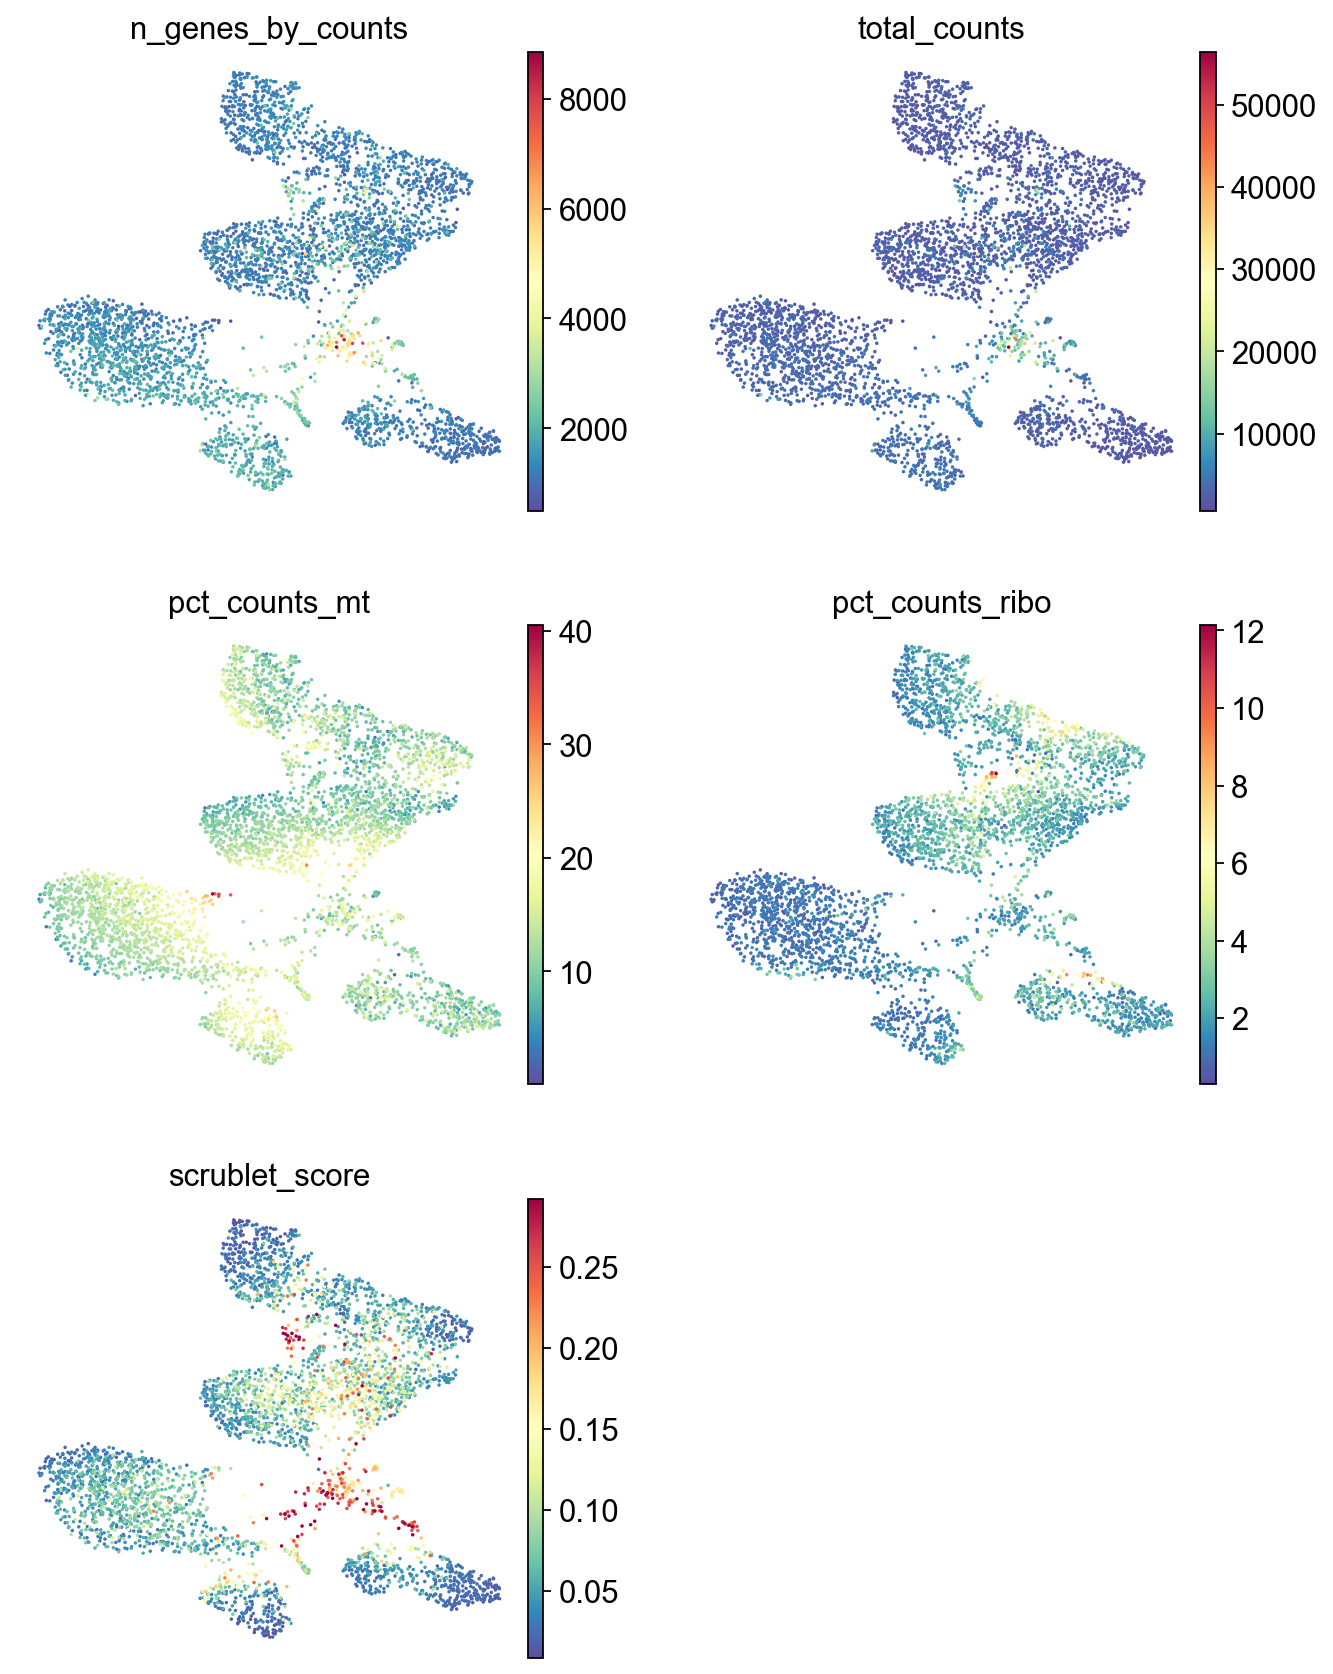
marker_gene_df = pd.read_csv(".../Data/Public/10x_Human_PBMC/PIASOmarkerDB_AllenHumanImmuneHealthAtlas_L2_251219.csv")marker_gene_dfmarker_gene_dict = {}cell_types = np.unique(marker_gene_df['Cell_Type'])for cell_type in cell_types: marker_gene_dict[cell_type] = list(marker_gene_df[marker_gene_df['Cell_Type']==cell_type]['Gene'])%%timepiaso.tl.infog(adata, copy=False, inplace=False, n_top_genes=3000, key_added='infog', key_added_highly_variable_gene='highly_variable', layer='raw')The normalized data is saved as `infog` in `adata.layers`.The highly variable genes are saved as `highly_variable` in `adata.var`.Finished INFOG normalization.CPU times: user 367 ms, sys: 2.83 ms, total: 369 msWall time: 370 ms%%timepiaso.tl.runSVD(adata, use_highly_variable=True, n_components=30, random_state=10, key_added='X_svd', layer='infog')CPU times: user 1.76 s, sys: 1.68 ms, total: 1.76 sWall time: 395 ms%%timesc.pp.neighbors(adata, use_rep='X_svd', n_neighbors=15, random_state=10, knn=True, method="umap")
sc.tl.umap(adata)CPU times: user 17.6 s, sys: 2.34 ms, total: 17.6 sWall time: 14.4 s%%timepiaso.tl.predictCellTypeByMarker(adata, marker_gene_set=marker_gene_dict, score_method='piaso', use_rep='X_svd', use_score=False, smooth_prediction=True, inplace=True)Calculating gene set scores using piaso method...Scoring gene sets: 100%|██████████| 29/29 [00:16<00:00, 1.72set/s]Predicting cell types based on marker gene p-values...Smoothing cell type predictions...Smoothing cell type predictions from 'CellTypes_predicted_raw' using 7-nearest neighborsSmoothed predictions stored in adata.obs['CellTypes_predicted_smoothed']Confidence scores stored in adata.obs['CellTypes_predicted_smoothed_confidence']Modified 934 cell labels (23.42% of total)Cell type prediction completed. Results saved to: - adata.obs['CellTypes_predicted']: predicted cell types - adata.obsm['CellTypes_predicted_score']: full score matrix - adata.obsm['CellTypes_predicted_nlog10pvals']: full -log10(p-value) matrix - adata.obs['CellTypes_predicted_nlog10pvals']: maximum -log10(p-values) - adata.obs['CellTypes_predicted_raw']: original unsmoothed predictions - adata.obs['CellTypes_predicted_confidence_smoothed']: smoothing confidence scoresCPU times: user 3.78 s, sys: 91.7 ms, total: 3.87 sWall time: 22 ssc.pl.umap(adata, color=['CellTypes_predicted'], palette=piaso.pl.color.d_color20, legend_fontsize=8, legend_fontoutline=1, # legend_loc='on data', ncols=1, size=10, frameon=False)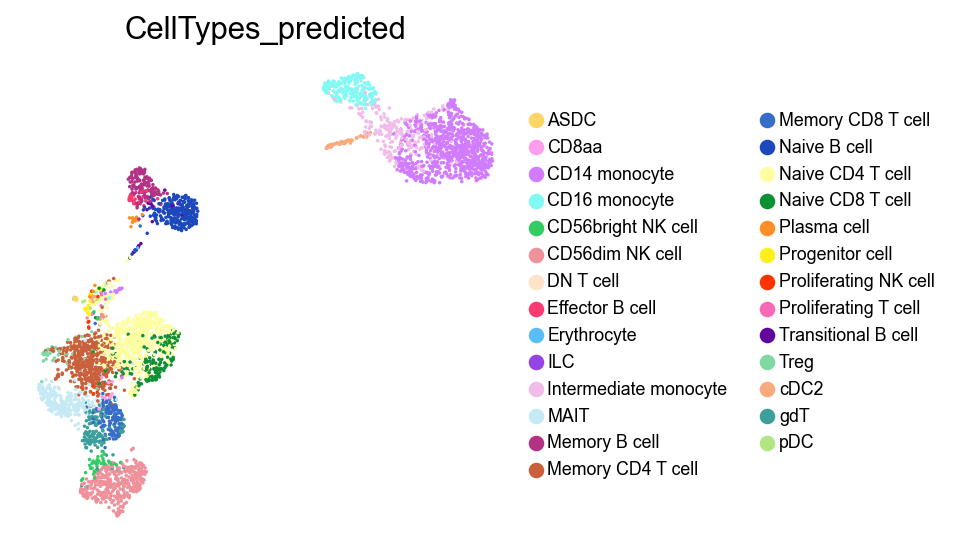
%%timesc.tl.leiden(adata,resolution=2.5,key_added='Leiden')<timed eval>:1: FutureWarning: In the future, the default backend for leiden will be igraph instead of leidenalg.
To achieve the future defaults please pass: flavor="igraph" and n_iterations=2. directed must also be False to work with igraph's implementation.CPU times: user 1.77 s, sys: 1.04 ms, total: 1.77 sWall time: 1.77 ssc.pl.umap(adata, color=['CellTypes_predicted','Leiden'], palette=piaso.pl.color.d_color20, legend_fontsize=12, legend_fontoutline=2, # legend_loc='on data', ncols=1, size=10, frameon=False)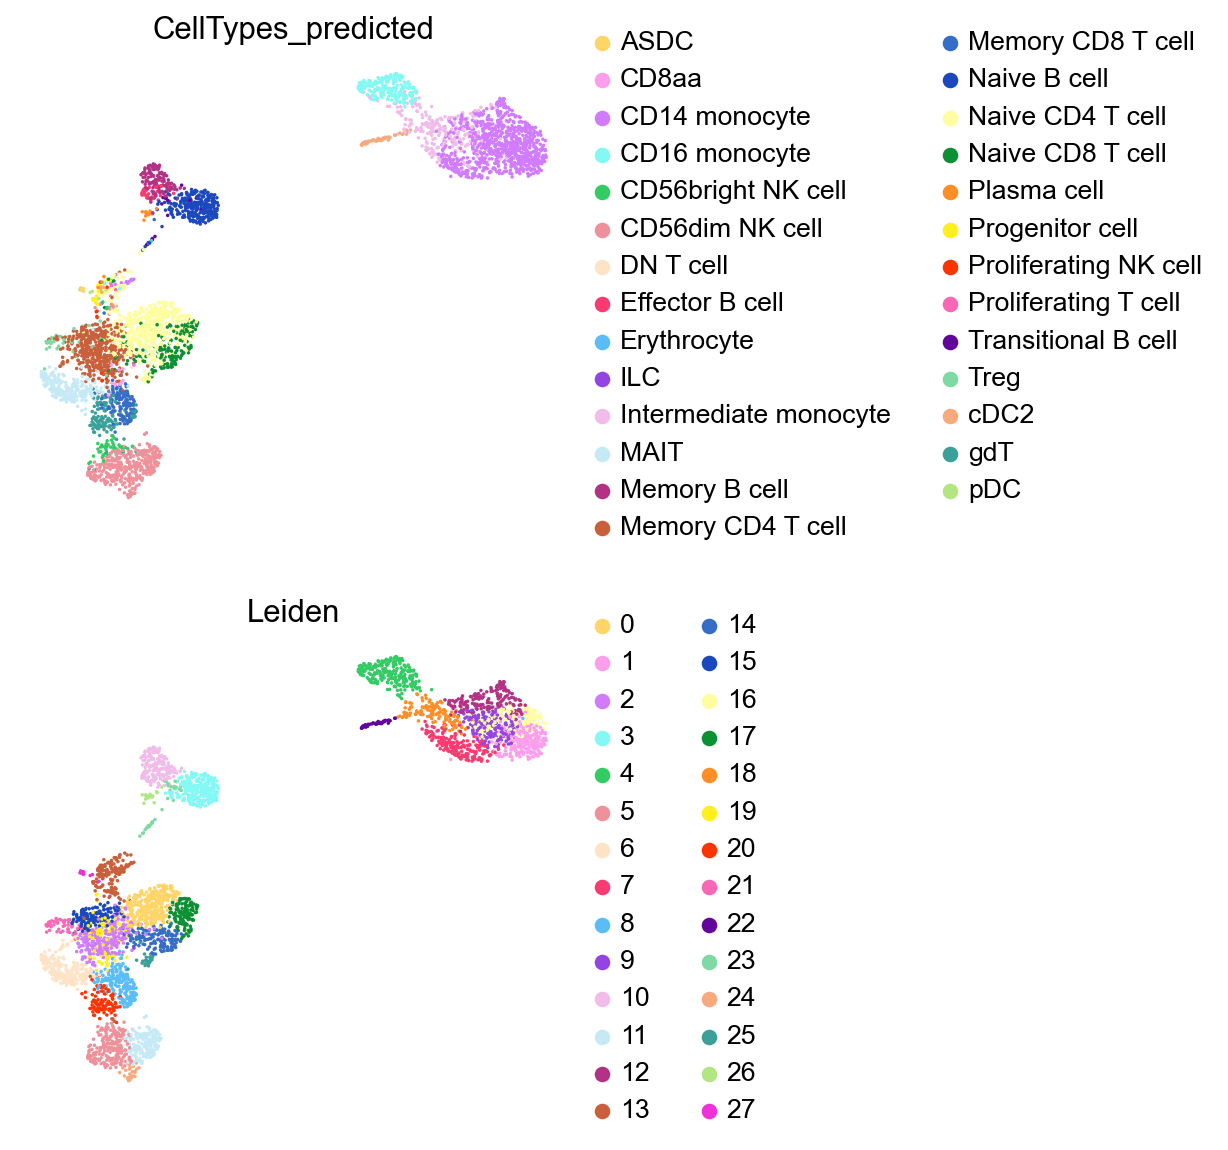
%%timen_gene=30cosg.cosg(adata, key_added='cosg', use_raw=False, layer='infog', mu=100, expressed_pct=0.1, remove_lowly_expressed=True, n_genes_user=n_gene, groupby='Leiden')CPU times: user 577 ms, sys: 1.92 ms, total: 579 msWall time: 580 mssc.tl.dendrogram(adata,groupby='Leiden',use_rep='X_svd')df_tmp=pd.DataFrame(adata.uns['cosg']['names'][:3,]).Tdf_tmp=df_tmp.reindex(adata.uns['dendrogram_'+'Leiden']['categories_ordered'])marker_genes_list={idx: list(row.values) for idx, row in df_tmp.iterrows()}marker_genes_list = {k: v for k, v in marker_genes_list.items() if not any(isinstance(x, float) for x in v)}
sc.pl.dotplot(adata, marker_genes_list, groupby='Leiden', layer='infog', dendrogram=True, swap_axes=False, standard_scale='var', cmap='Spectral_r')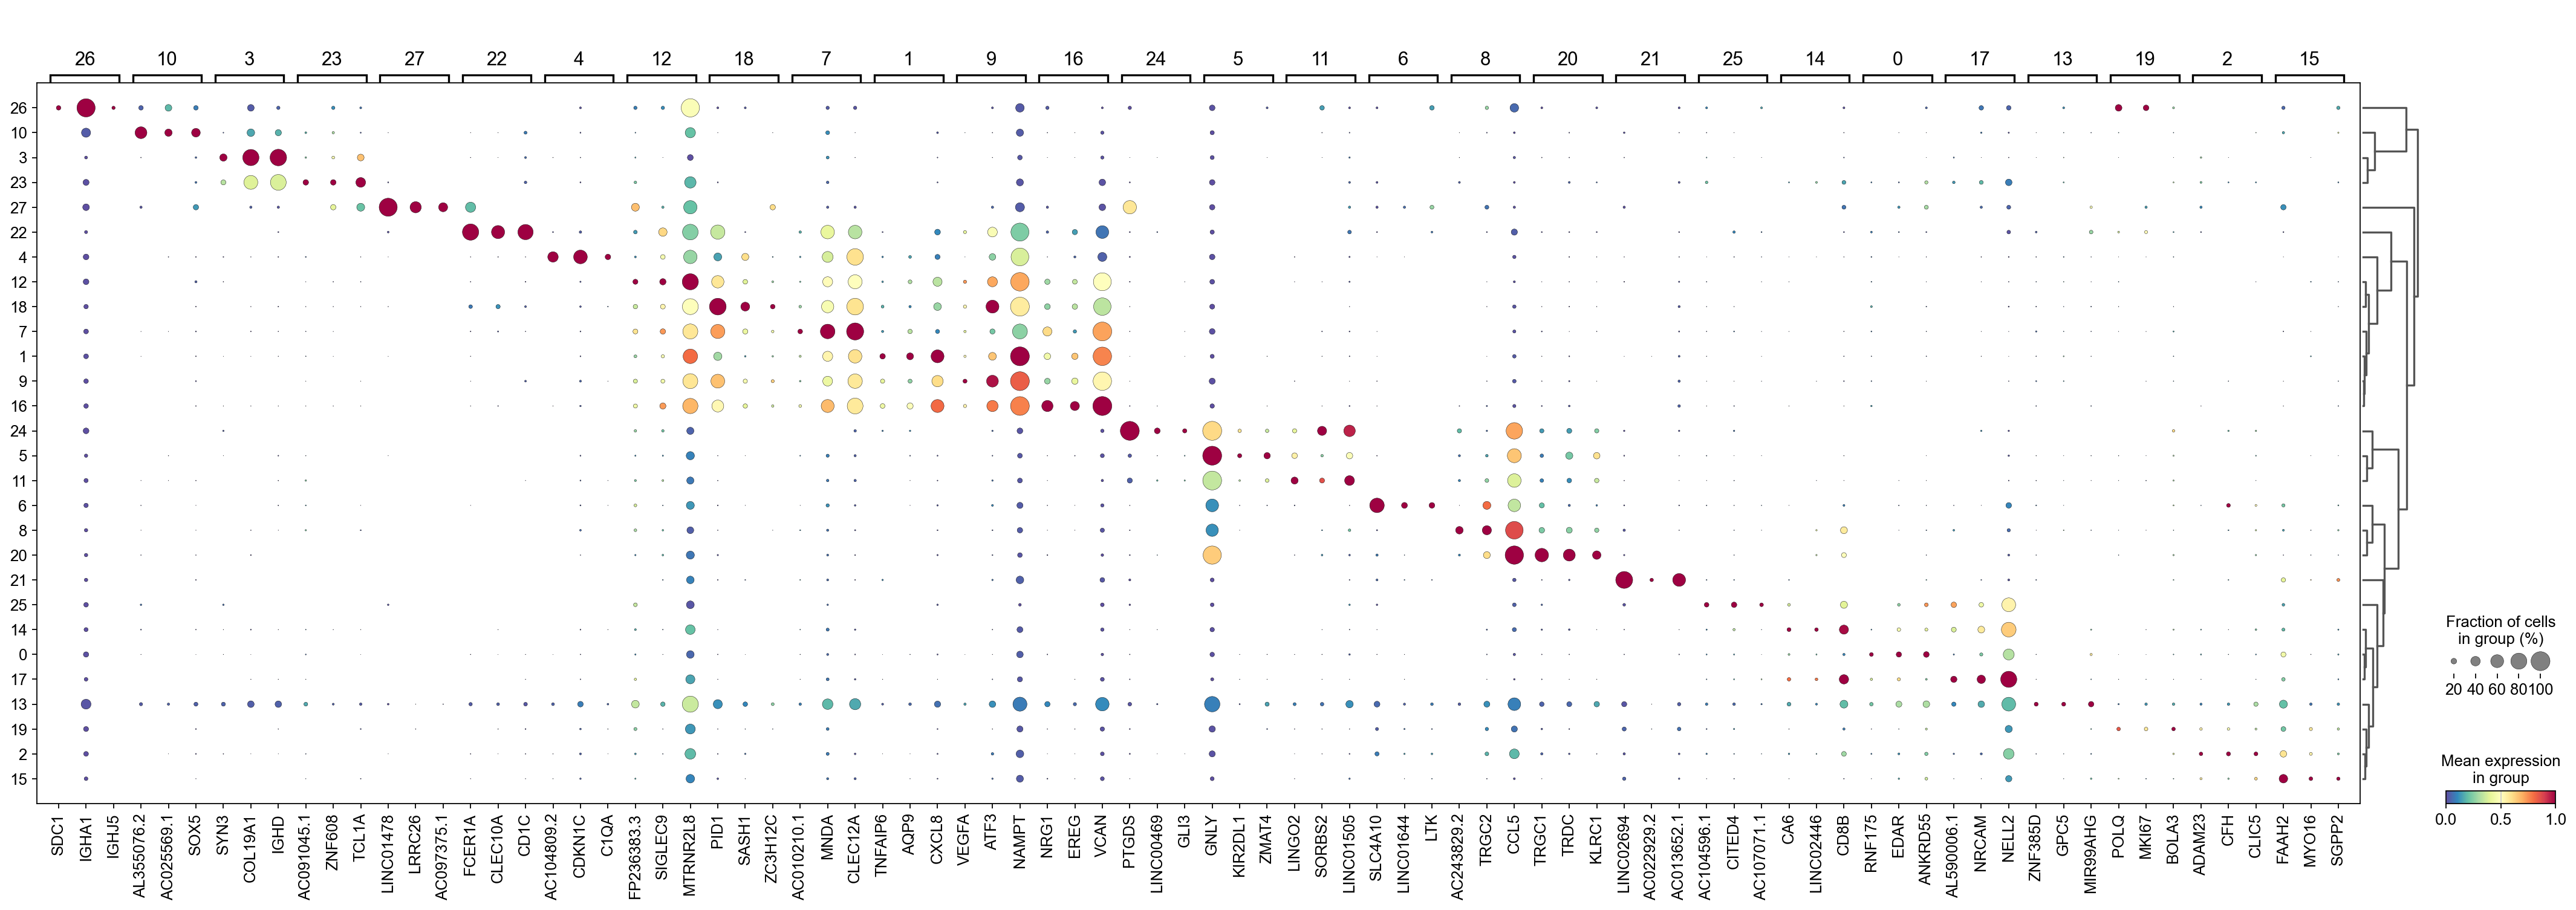
marker_gene=pd.DataFrame(adata.uns['cosg']['names'])piaso.pl.plot_features_violin(adata, ['n_genes_by_counts', 'total_counts', 'pct_counts_mt','pct_counts_ribo', 'scrublet_score'], groupby='Leiden')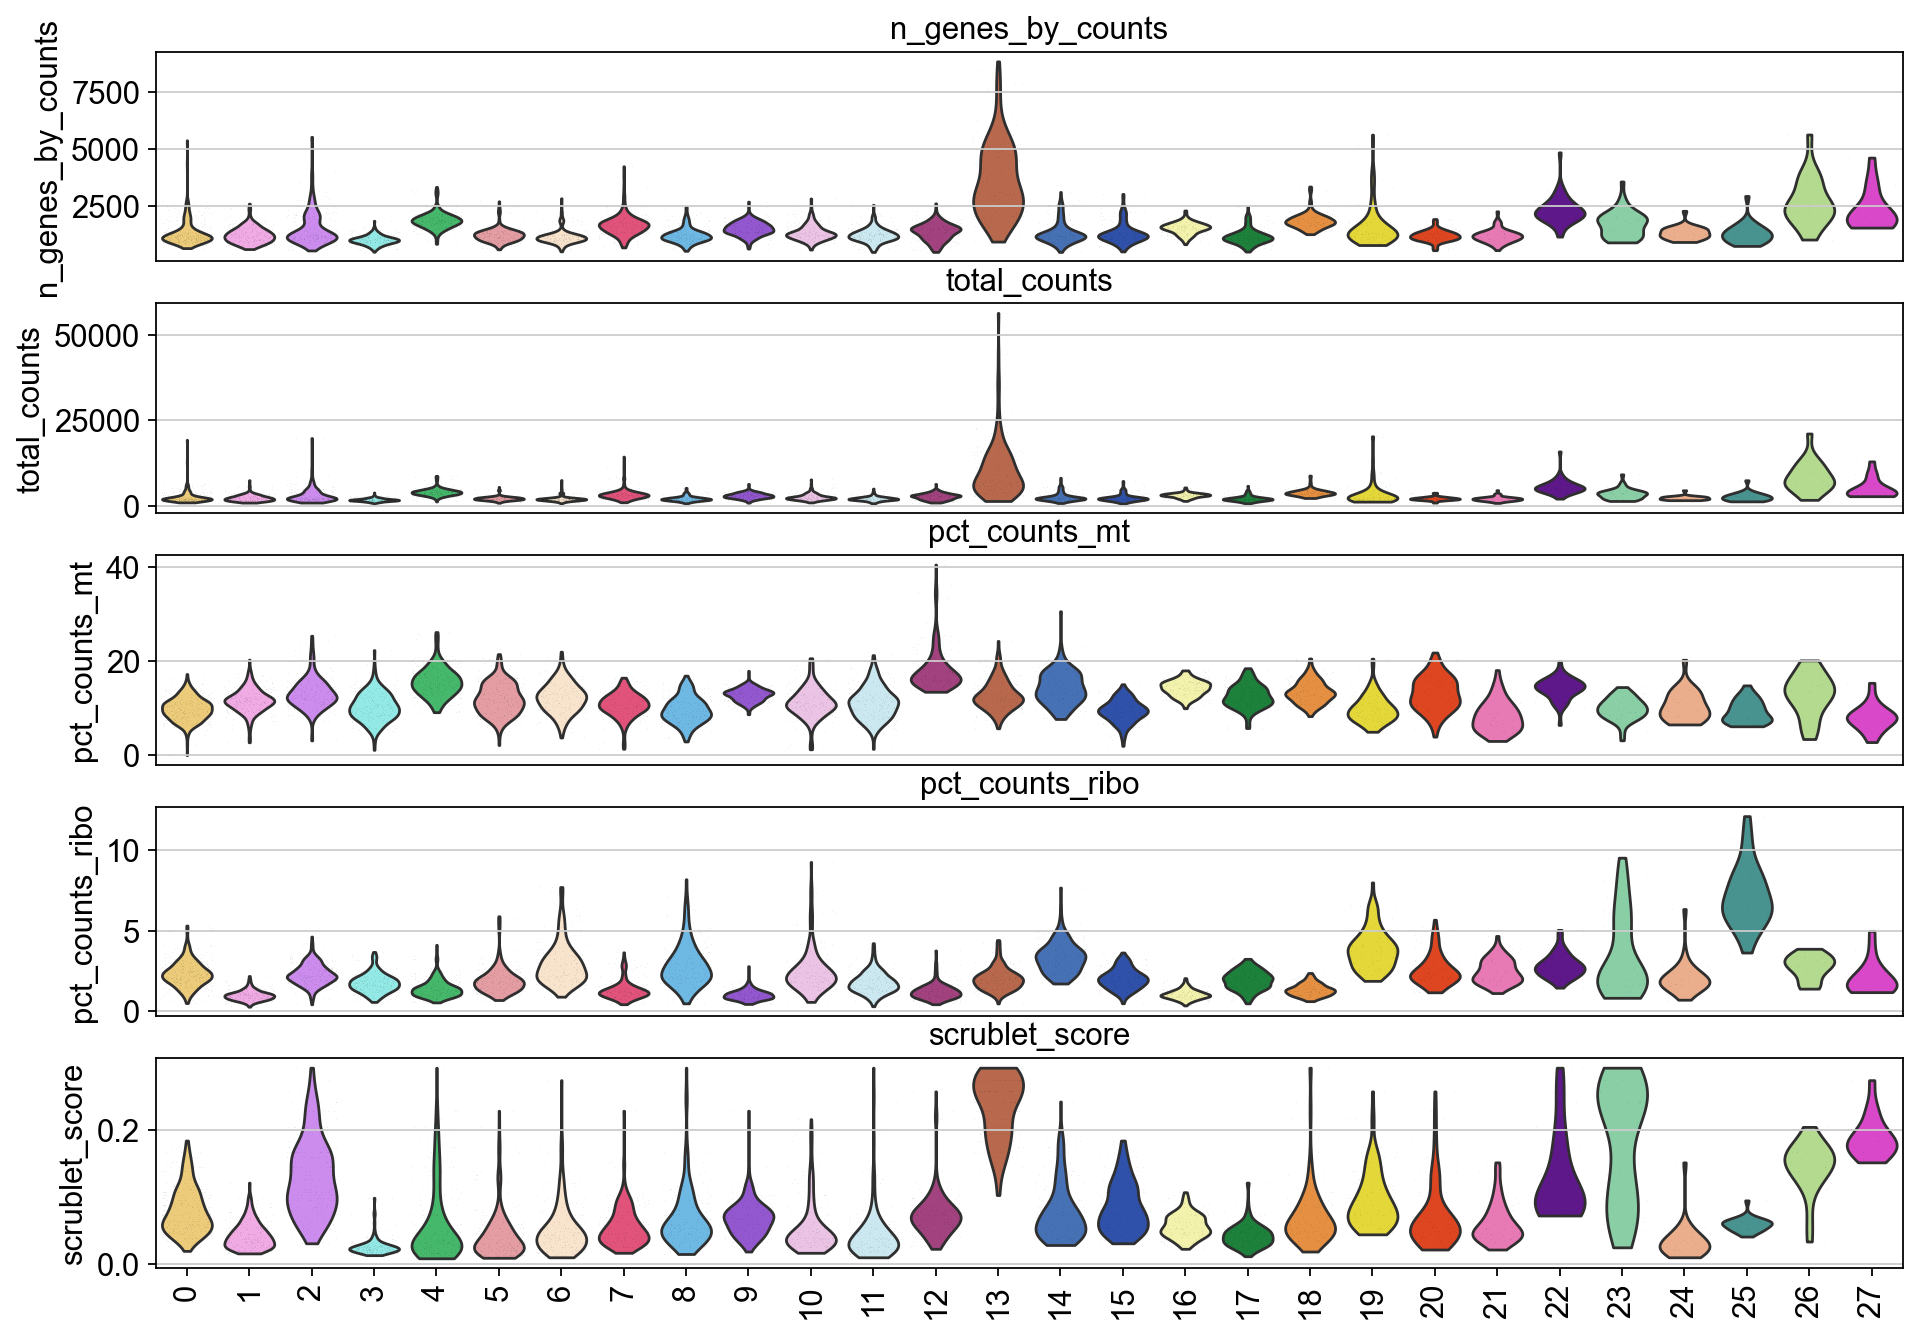
adata = adata[adata.obs['pct_counts_mt']<20].copy()adata = adata[adata.obs['pct_counts_ribo']<5].copy()sc.pl.umap(adata, color=['n_genes_by_counts', 'total_counts','pct_counts_mt','pct_counts_ribo', 'scrublet_score'], cmap='Spectral_r', palette=piaso.pl.color.d_color1, ncols=2, size=10, frameon=False)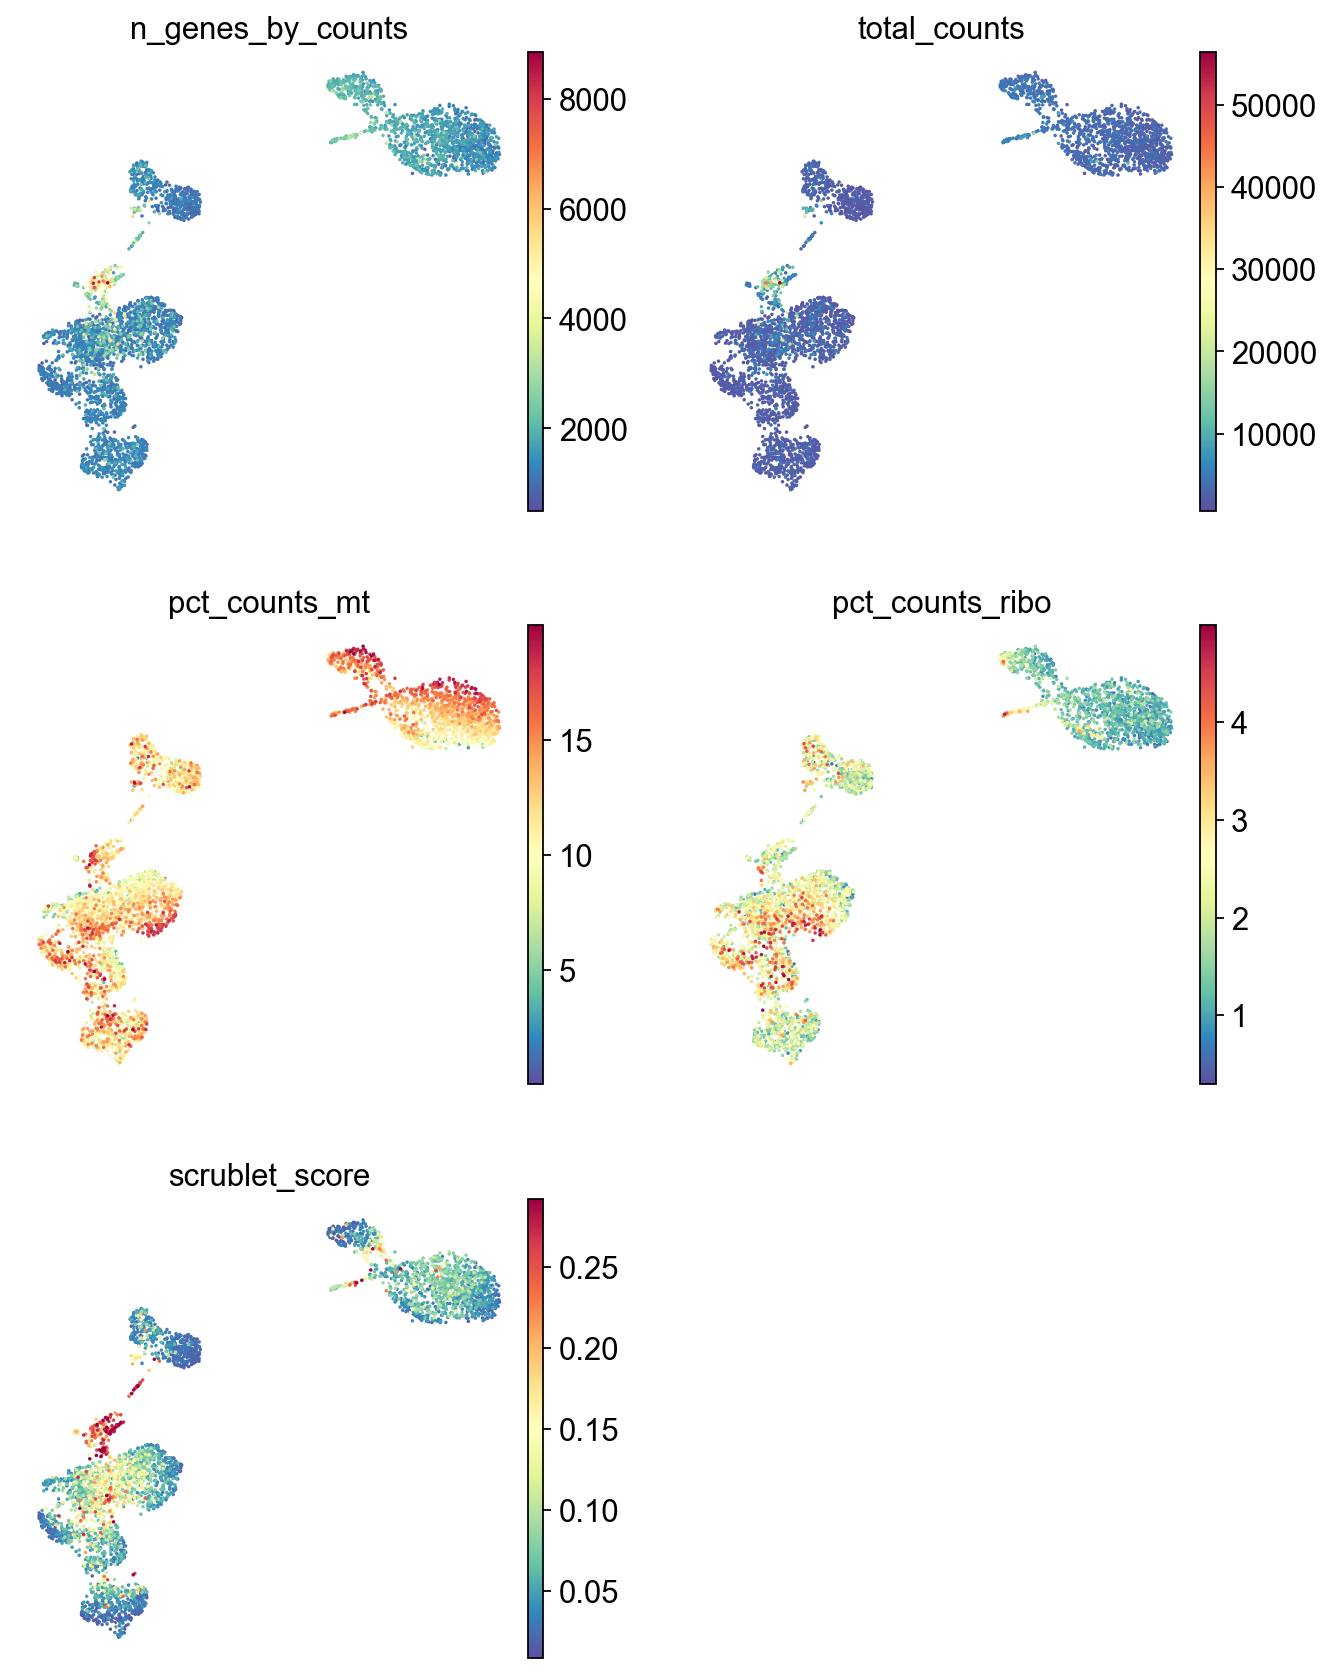
sc.pl.umap(adata, color=['Leiden'], palette=piaso.pl.color.d_color20, legend_fontsize=12, legend_fontoutline=2, # legend_loc='on data', ncols=1, size=10, frameon=False)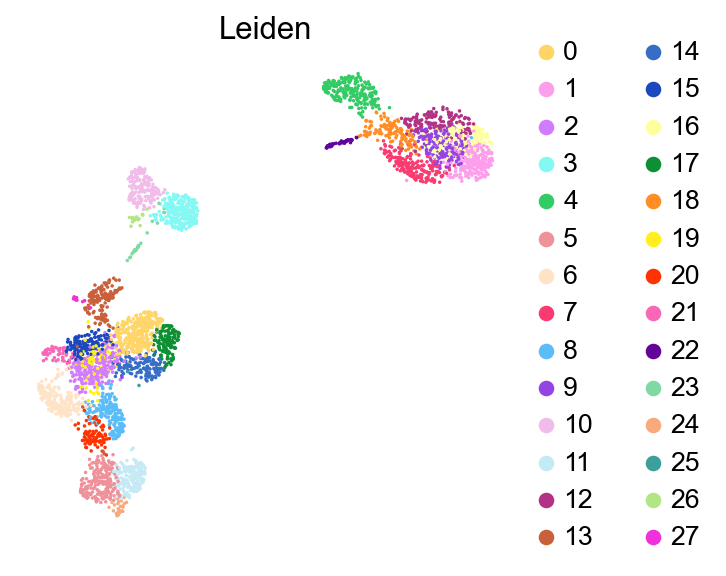
cluster_check = '12'marker_gene[cluster_check].valuesarray(['FP236383.3', 'SIGLEC9', 'MTRNR2L8', 'SIRPA', 'GABARAPL1', 'MT-ND1', 'FAM157C', 'SMIM13', 'ADAMTSL4-AS1', 'OLR1', 'EPB41L3', 'ATG16L2', 'CSF3R', 'ADAM15', 'NAMPT', 'CCL3L1', 'NACC2', 'S100A9', 'S100A12', 'YBX3', 'TYMP', 'STAB1', 'PLAUR', 'CD14', 'PTPRE', 'KDM6B', 'ACSS2', 'NR4A3', 'FRMD4B', 'NEAT1'], dtype=object)sc.pl.umap(adata, color=['FP236383.3', 'SIGLEC9', 'MTRNR2L8', 'SIRPA', 'GABARAPL1', 'MT-ND1', 'FAM157C', 'SMIM13', 'ADAMTSL4-AS1', 'OLR1', 'EPB41L3'], cmap=piaso.pl.color.c_color1, palette=piaso.pl.color.d_color1, ncols=3, size=10, frameon=False)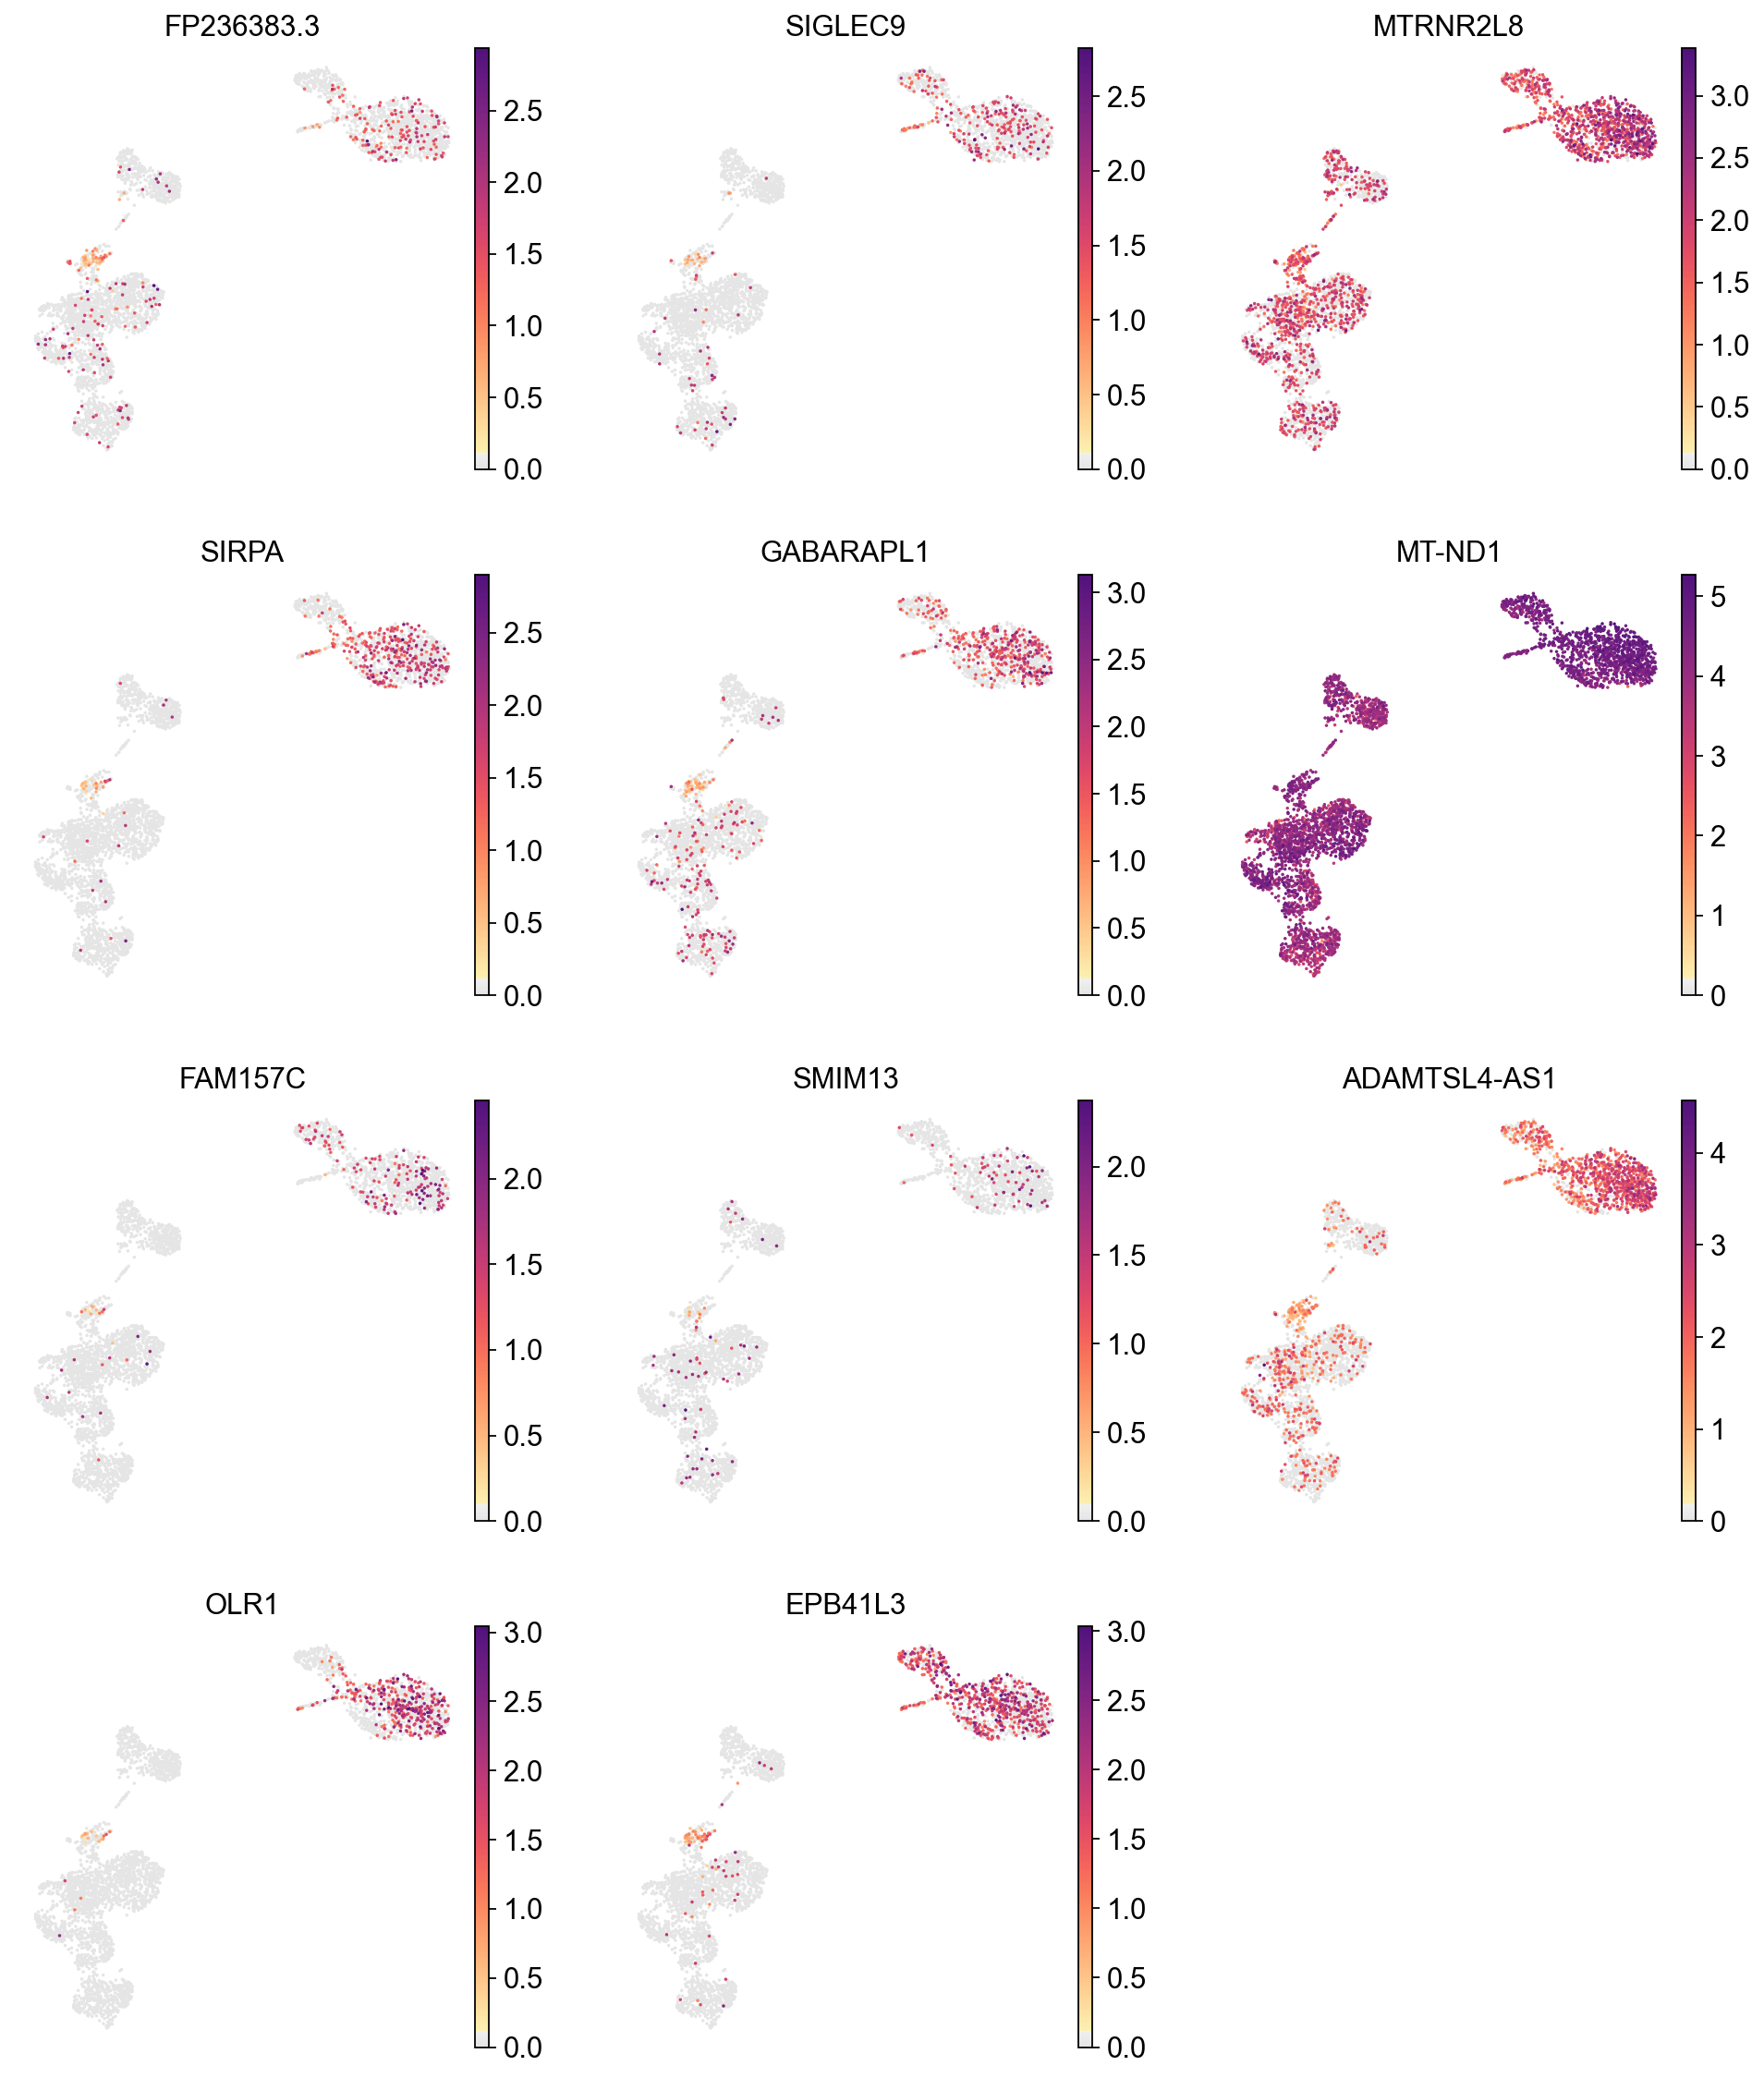
sc.pl.dotplot(adata, marker_gene[cluster_check].values[:30], groupby='Leiden', dendrogram=False, swap_axes=True, standard_scale='var', cmap='Spectral_r')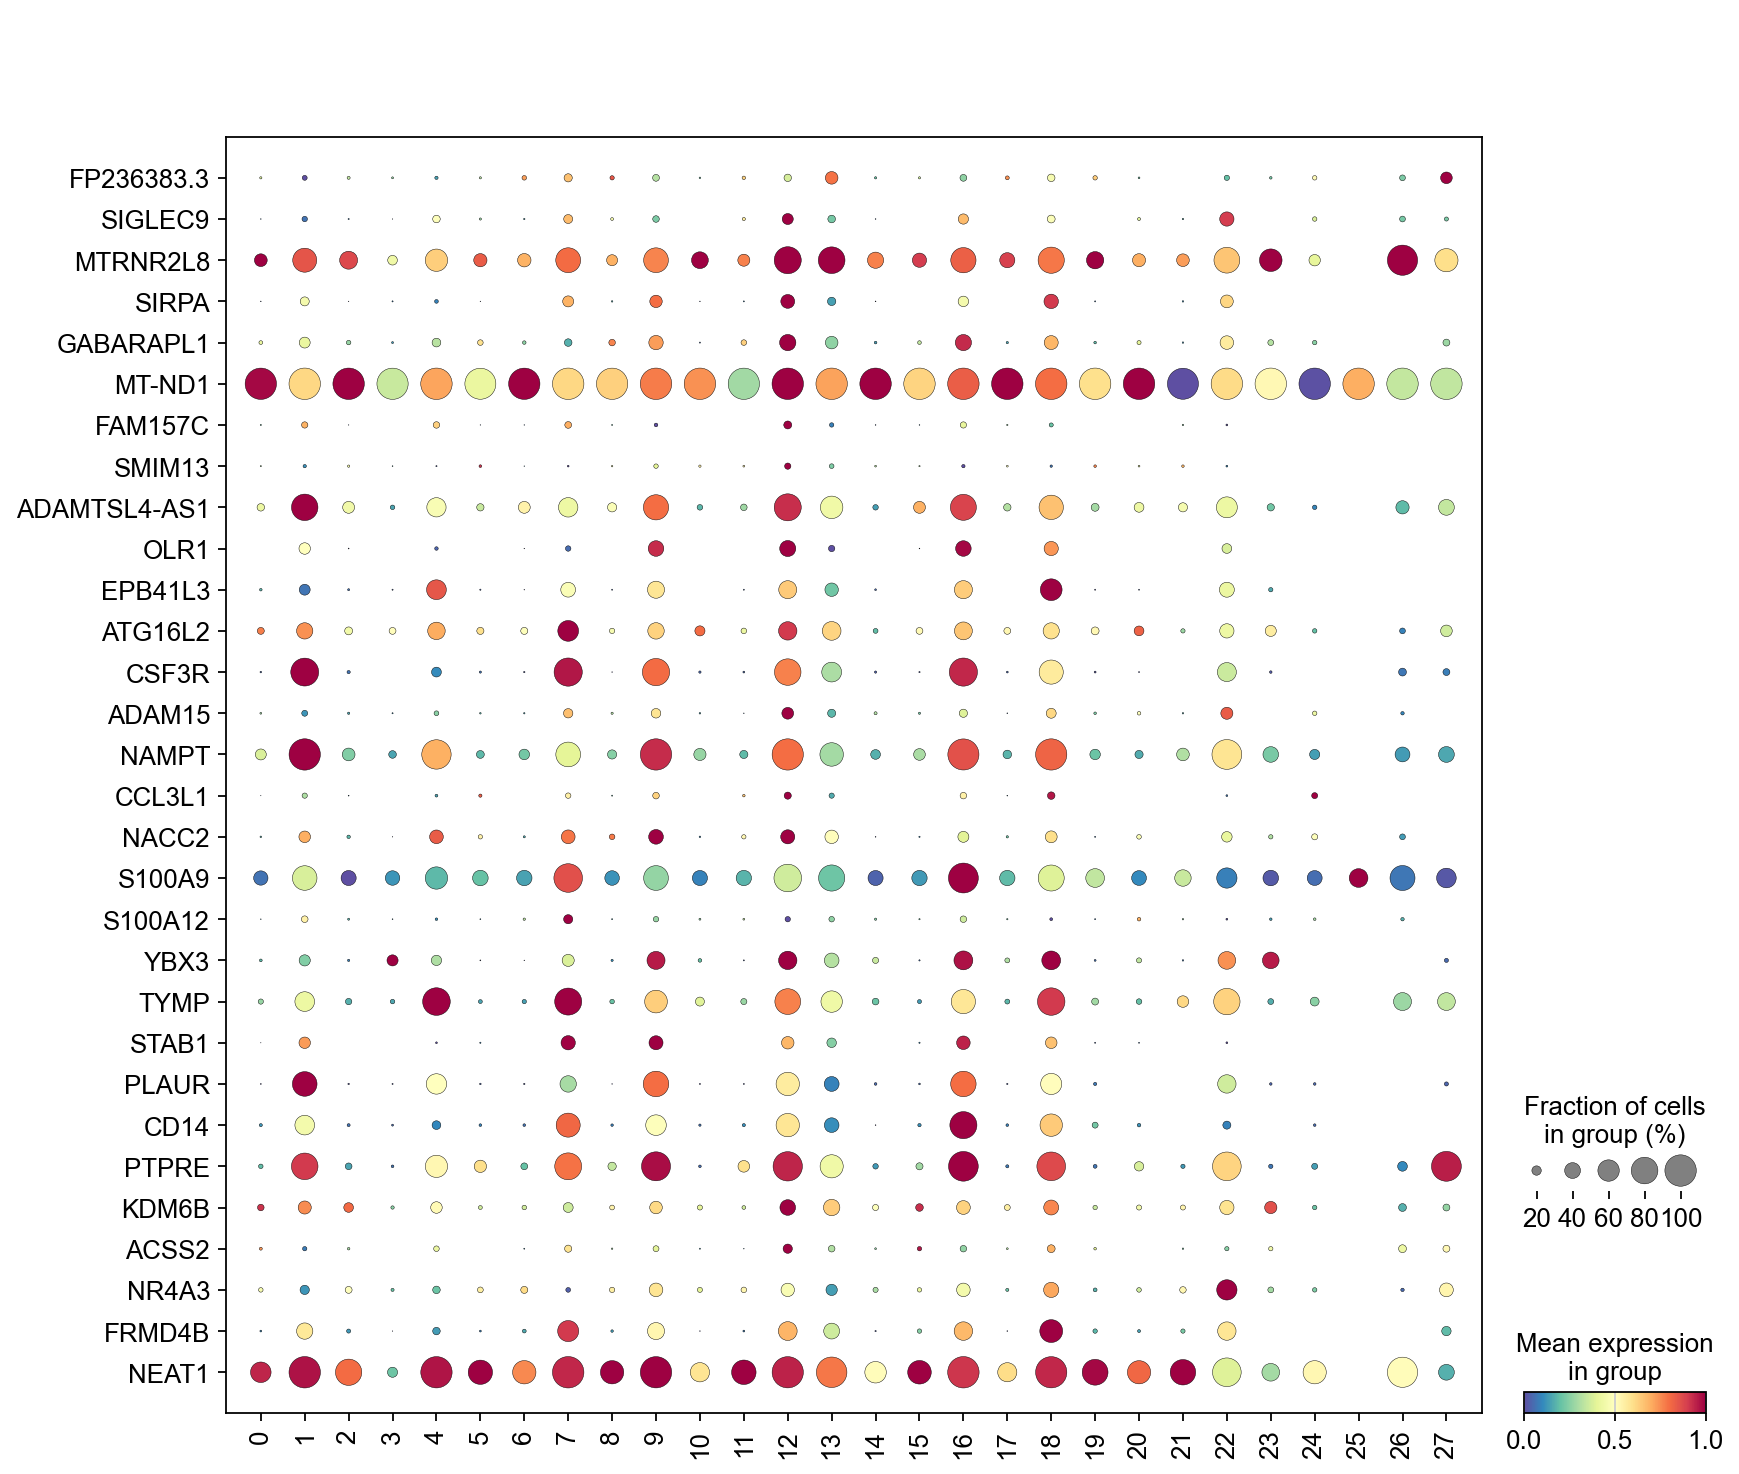
sc.pl.umap(adata, color=['Leiden'], groups=['12','13','23','25'], palette=piaso.pl.color.d_color20, legend_fontsize=12, legend_fontoutline=2, # legend_loc='on data', ncols=1, size=10, frameon=False)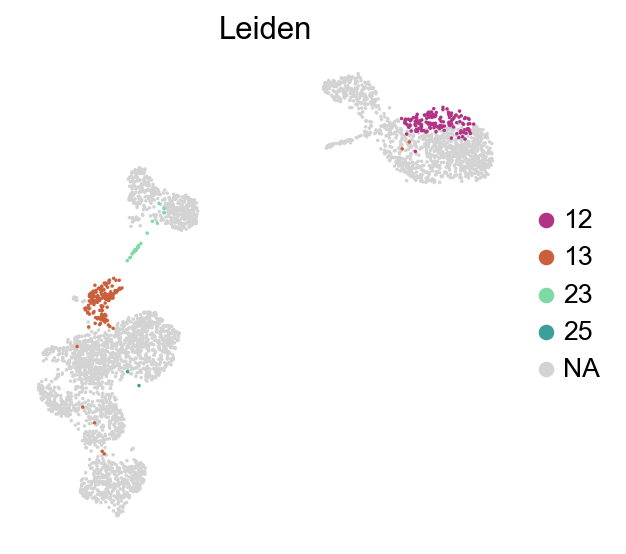
adata=adata[~adata.obs['Leiden'].isin(['12','13','23','25'])].copy()%%timepiaso.tl.infog(adata, copy=False, inplace=False, n_top_genes=3000, key_added='infog', key_added_highly_variable_gene='highly_variable', layer='raw')The normalized data is saved as `infog` in `adata.layers`.The highly variable genes are saved as `highly_variable` in `adata.var`.Finished INFOG normalization.CPU times: user 310 ms, sys: 113 ms, total: 422 msWall time: 423 ms%%timepiaso.tl.runSVD(adata, use_highly_variable=True, n_components=30, random_state=10, key_added='X_svd', layer='infog')CPU times: user 2.08 s, sys: 2.67 ms, total: 2.09 sWall time: 366 ms%%timesc.pp.neighbors(adata, use_rep='X_svd', n_neighbors=15, random_state=10, knn=True, method="umap")
sc.tl.umap(adata)CPU times: user 14.3 s, sys: 6.15 ms, total: 14.3 sWall time: 11.4 s%%timepiaso.tl.predictCellTypeByMarker(adata, marker_gene_set=marker_gene_dict, score_method='piaso', use_rep='X_svd', use_score=False, key_added = 'CellTypes_predicted', smooth_prediction=True, inplace=True)Calculating gene set scores using piaso method...Scoring gene sets: 100%|██████████| 29/29 [00:15<00:00, 1.91set/s]Predicting cell types based on marker gene p-values...Smoothing cell type predictions...Smoothing cell type predictions from 'CellTypes_predicted_raw' using 7-nearest neighborsSmoothed predictions stored in adata.obs['CellTypes_predicted_smoothed']Confidence scores stored in adata.obs['CellTypes_predicted_smoothed_confidence']Modified 766 cell labels (22.07% of total)Cell type prediction completed. Results saved to: - adata.obs['CellTypes_predicted']: predicted cell types - adata.obsm['CellTypes_predicted_score']: full score matrix - adata.obsm['CellTypes_predicted_nlog10pvals']: full -log10(p-value) matrix - adata.obs['CellTypes_predicted_nlog10pvals']: maximum -log10(p-values) - adata.obs['CellTypes_predicted_raw']: original unsmoothed predictions - adata.obs['CellTypes_predicted_confidence_smoothed']: smoothing confidence scoresCPU times: user 3.2 s, sys: 73 ms, total: 3.28 sWall time: 19.8 ssc.pl.umap(adata, color=['CellTypes_predicted'], palette=piaso.pl.color.d_color20, legend_fontsize=8, legend_fontoutline=1, # legend_loc='on data', ncols=1, size=10, frameon=False)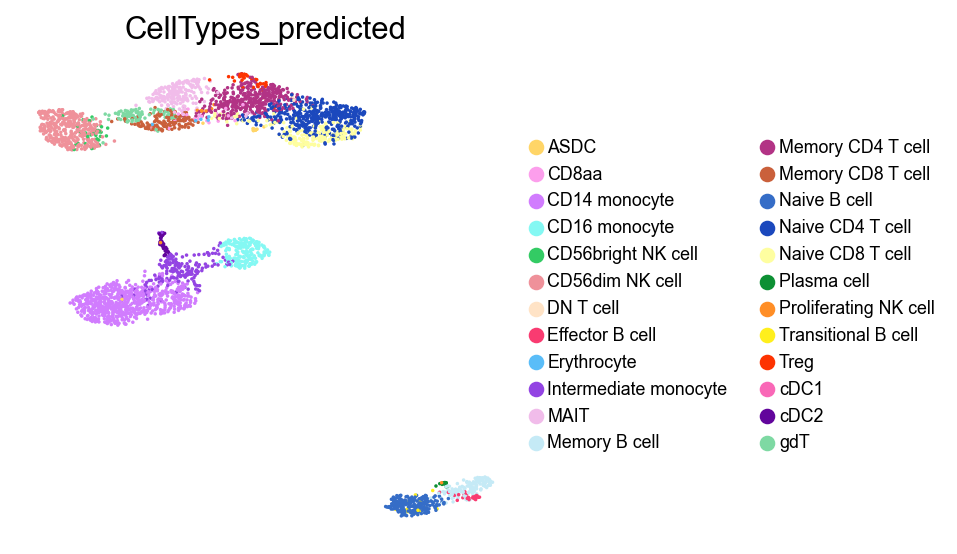
%%timen_gene=30cosg.cosg(adata, key_added='cosg', use_raw=False, layer='infog', mu=100, expressed_pct=0.1, remove_lowly_expressed=True, n_genes_user=n_gene, groupby='CellTypes_predicted')CPU times: user 449 ms, sys: 1.99 ms, total: 451 msWall time: 452 msmarker_gene=pd.DataFrame(adata.uns['cosg']['names'])marker_genesc.tl.dendrogram(adata,groupby='CellTypes_predicted',use_rep='X_svd')df_tmp=pd.DataFrame(adata.uns['cosg']['names'][:3,]).Tdf_tmp=df_tmp.reindex(adata.uns['dendrogram_'+'CellTypes_predicted']['categories_ordered'])marker_genes_list={idx: list(row.values) for idx, row in df_tmp.iterrows()}marker_genes_list = {k: v for k, v in marker_genes_list.items() if not any(isinstance(x, float) for x in v)}
sc.pl.dotplot(adata, marker_genes_list, groupby='CellTypes_predicted', layer='infog', dendrogram=True, swap_axes=False, standard_scale='var', cmap='Spectral_r')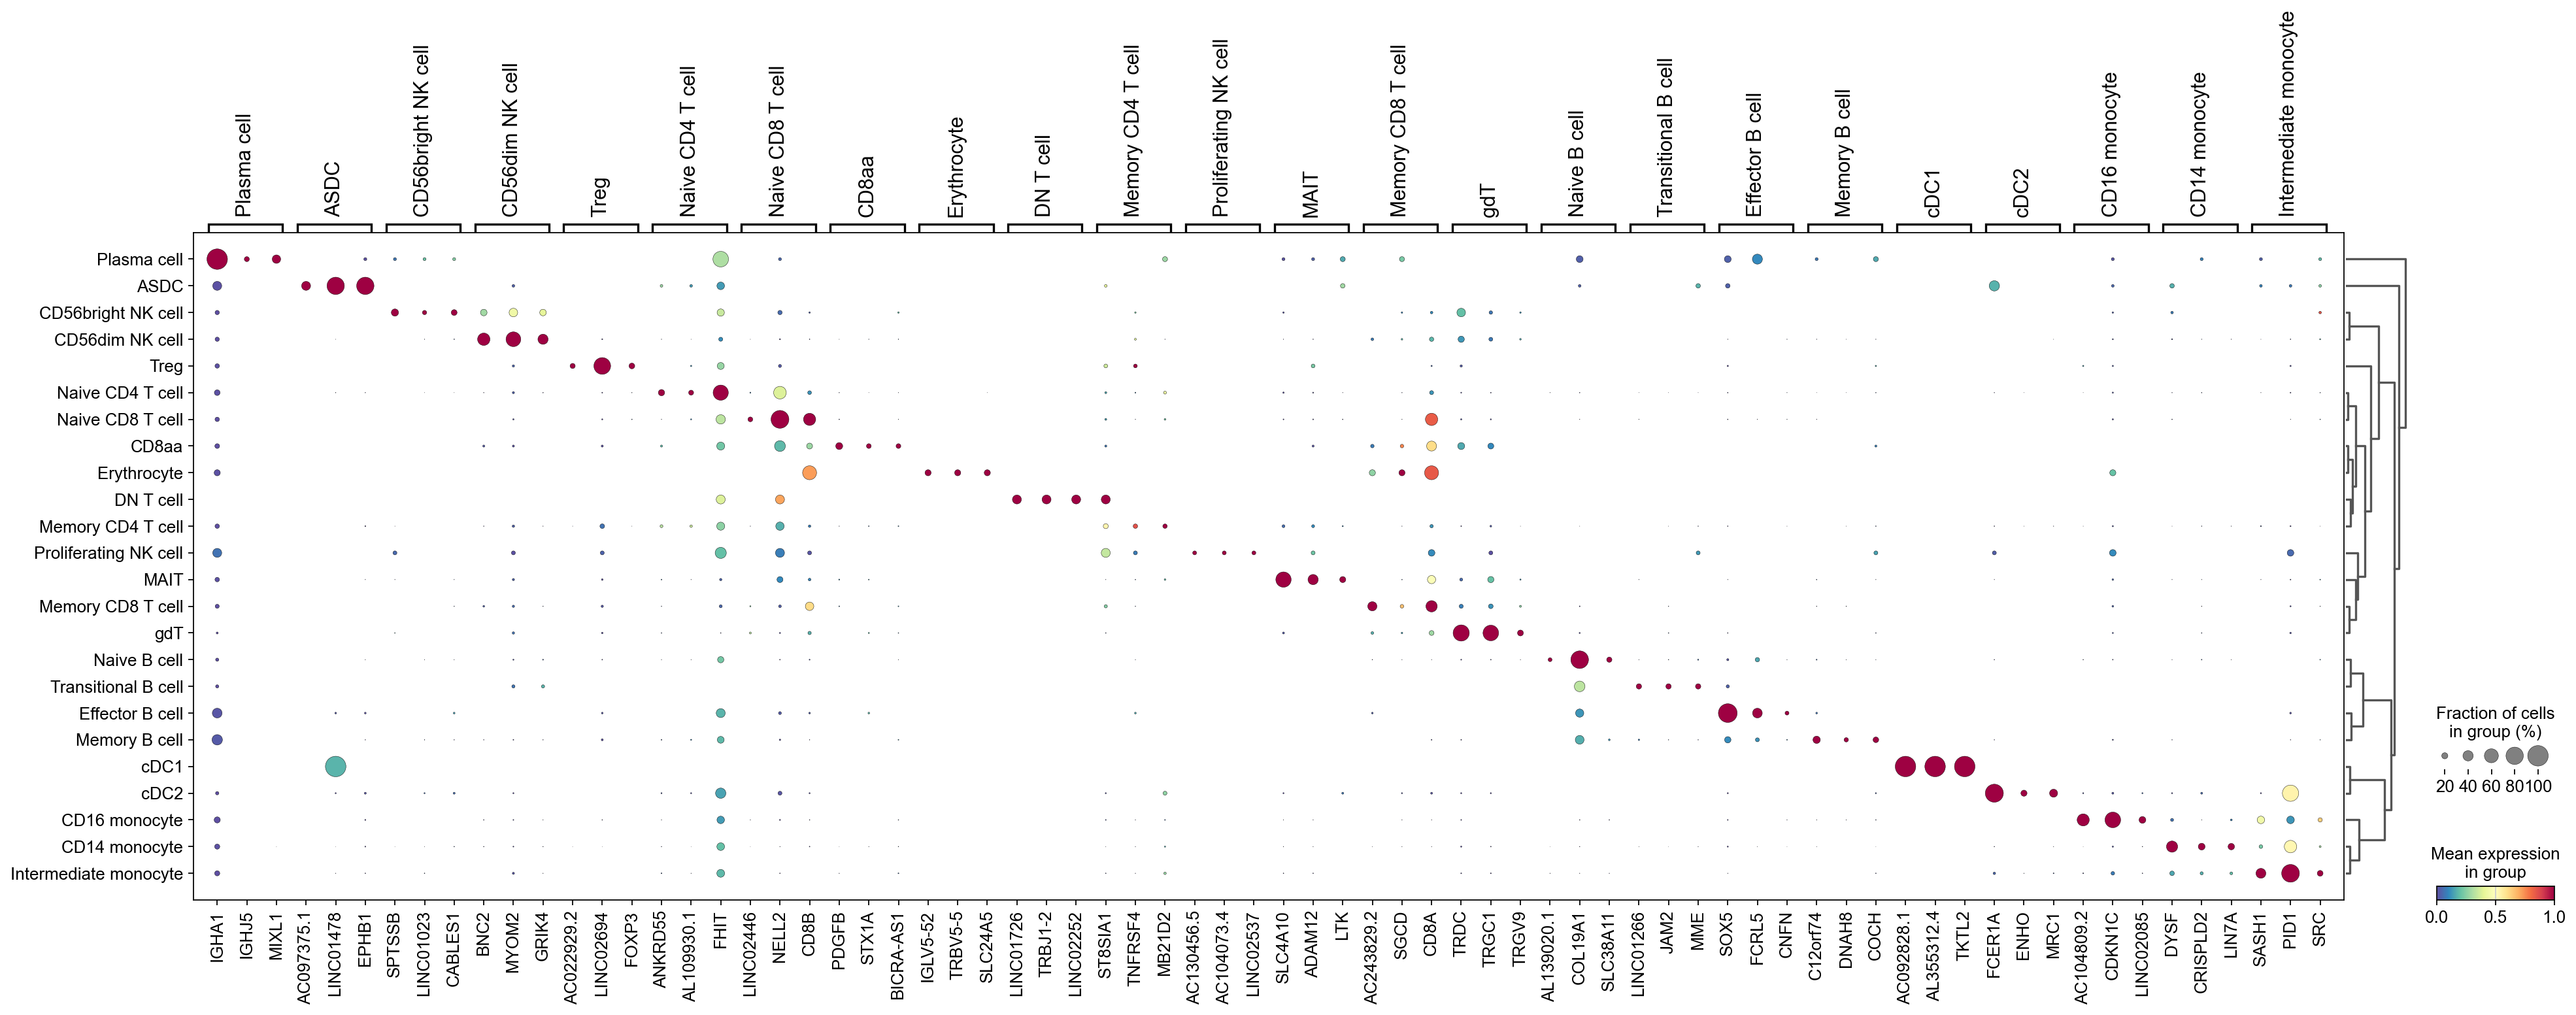
cluster_check = 'CD16 monocyte'marker_gene[cluster_check].valuesarray(['AC104809.2', 'CDKN1C', 'LINC02085', 'LYPD2', 'GPR20', 'AC020651.2', 'PPP1R17', 'CKB', 'HES4', 'LYNX1', 'CROCC2', 'VMO1', 'FMNL2', 'PAPSS2', 'NEURL1', 'SMIM25', 'C1QA', 'ICAM4', 'TCF7L2', 'LINC02345', 'SFTPD', 'CEACAM3', 'KNDC1', 'LST1', 'MS4A7', 'SIGLEC10', 'CLEC4F', 'FCGR3A', 'CTSL', 'SPRED1'], dtype=object)sc.pl.umap(adata, color=['AC104809.2', 'GPR20', 'CDKN1C', 'AC020651.2', 'C1QA', 'LINC02085', 'LYPD2', 'PPP1R17', 'CKB', 'HES4', 'CROCC2', 'FMNL2', 'VMO1'], cmap=piaso.pl.color.c_color1, palette=piaso.pl.color.d_color1, ncols=3, size=10, frameon=False)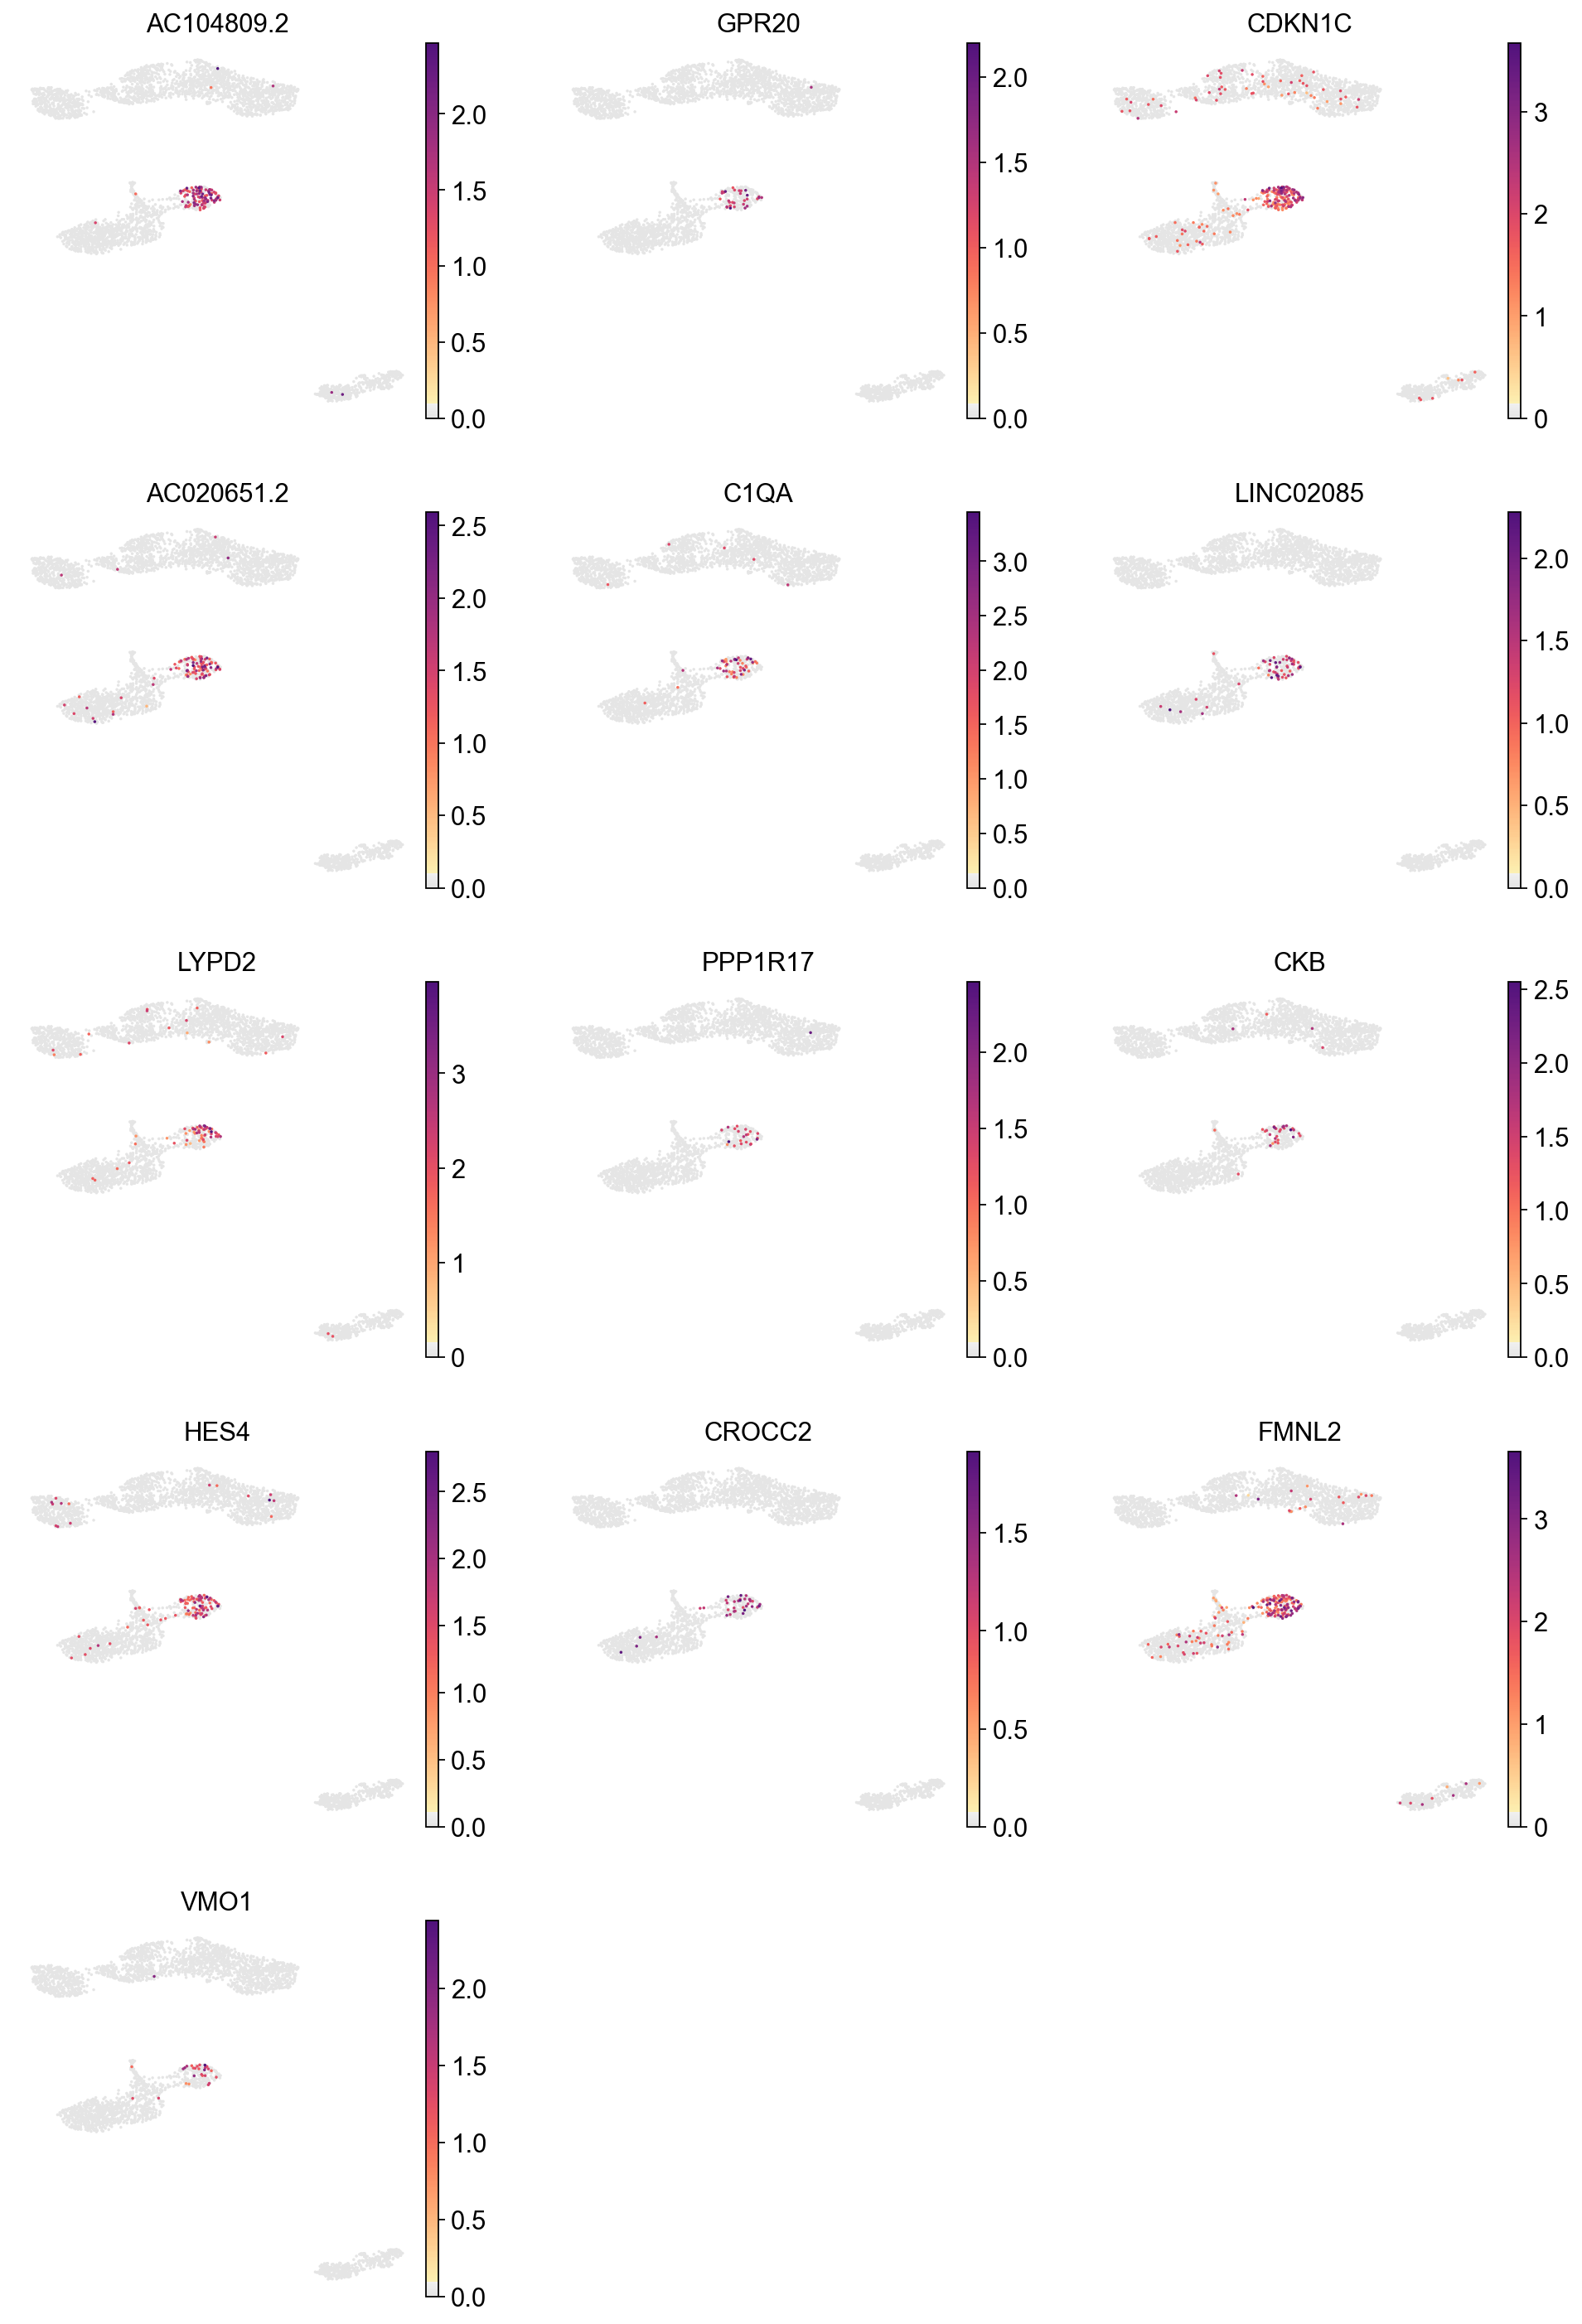
sc.pl.dotplot(adata, marker_gene[cluster_check].values[:30], groupby='CellTypes_predicted', dendrogram=False, swap_axes=True, standard_scale='var', cmap='Spectral_r')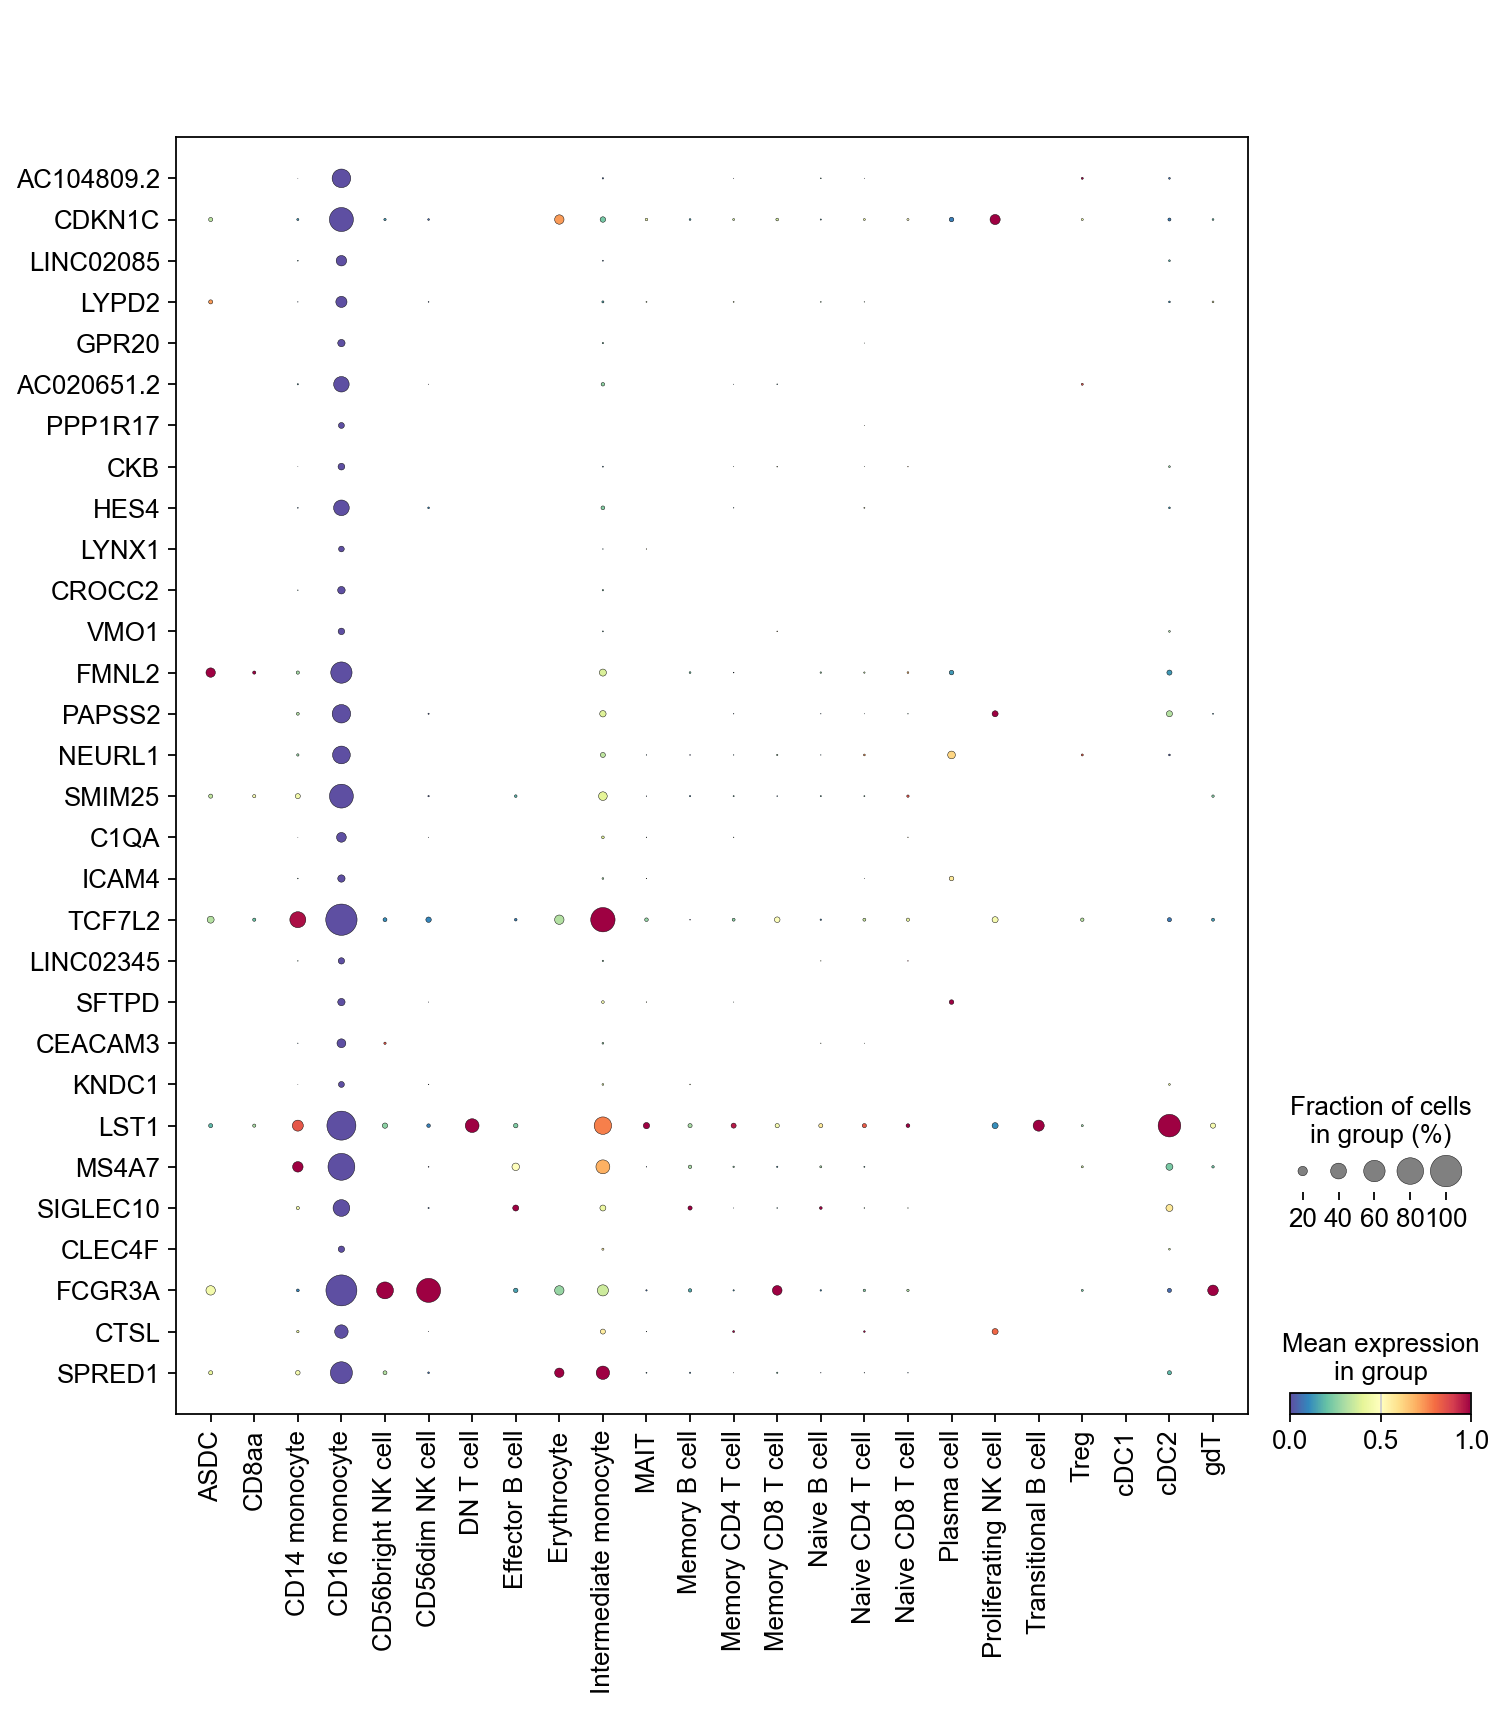
np.unique(adata.obs['CellTypes_predicted'])array(['ASDC', 'CD14 monocyte', 'CD16 monocyte', 'CD56bright NK cell', 'CD56dim NK cell', 'CD8aa', 'DN T cell', 'Effector B cell', 'Erythrocyte', 'Intermediate monocyte', 'MAIT', 'Memory B cell', 'Memory CD4 T cell', 'Memory CD8 T cell', 'Naive B cell', 'Naive CD4 T cell', 'Naive CD8 T cell', 'Plasma cell', 'Proliferating NK cell', 'Transitional B cell', 'Treg', 'cDC1', 'cDC2', 'gdT'], dtype=object)adata.obs['Sample'] = 0adata.write(save_dir + '/' + prefix + '_QC.h5ad')marker_gene.to_csv(save_dir + '/' + prefix + 'CellType_markerGenes.csv')# adata = sc.read(save_dir + '/' + prefix + '_QC.h5ad')# adata