Cell type prediction based on marker genes from reference dataset
Cell type prediction based on marker genes from reference dataset
import numpy as npimport pandas as pdimport scanpy as scsc.set_figure_params(dpi=80,dpi_save=300, color_map='viridis',facecolor='white')from matplotlib import rcParams# To modify the default figure size, use rcParams.rcParams['figure.figsize'] = 4, 4rcParams['font.sans-serif'] = "Arial"rcParams['font.family'] = "Arial"sc.settings.verbosity = 3sc.logging.print_header()/tmp/ipykernel_1586743/1353975569.py:11: RuntimeWarning: Failed to import dependencies for application/vnd.jupyter.widget-view+json representation. (ModuleNotFoundError: No module named 'ipywidgets') sc.logging.print_header()| Dependency | Version || --------------- | ------------------- || wcwidth | 0.2.13 || ipython | 8.30.0 || cycler | 0.12.1 || debugpy | 1.8.16 || natsort | 8.4.0 || pytz | 2025.2 || llvmlite | 0.46.0 || igraph | 0.11.9 || asttokens | 3.0.0 || h5py | 3.15.1 || numba | 0.63.1 || joblib | 1.5.3 || psutil | 7.0.0 || pillow | 12.0.0 || setuptools | 80.9.0 || parso | 0.8.5 || executing | 2.2.1 || kiwisolver | 1.4.9 || torch | 2.9.1 (2.9.1+cu128) || leidenalg | 0.10.2 || tqdm | 4.67.1 || six | 1.17.0 || tornado | 6.5.4 |... [15 more lines]path = '.../Analysis/Jupyter/Python/Longitudinal/Integration'import syssys.path.append(path)from env_settings import *sc.set_figure_params(dpi=80,dpi_save=300, color_map='viridis',facecolor='white')rcParams['figure.figsize'] = 4, 4save_dir='.../Result/single-cell/Methods/COSG/Database'### Create the save_dir if not existed!mkdir -p {save_dir}adata=sc.read('.../Result/single-cell/Enhancer/AdultCortexMultiome/AdultCortexMultiomeRNA_integrated_anno.h5ad')sc.pl.umap(adata, color=['CellTypes'], palette=self_palette2, # legend_loc='on data', legend_fontoutline=2, legend_fontweight=5, cmap='Spectral_r', ncols=3, size=10, frameon=False)mkdir -p .../Result/single-cell/Enhancer/WholeMouseBrainRNAAllencd .../Result/single-cell/Enhancer/WholeMouseBrainRNAAllengdrive files download 1O-PCQn0kpzxyrVxBKWDb6Piuusnf3IPwgdrive files download 1G8V1SKBXbR8YsTKfkC_W6ce0mq47A7PV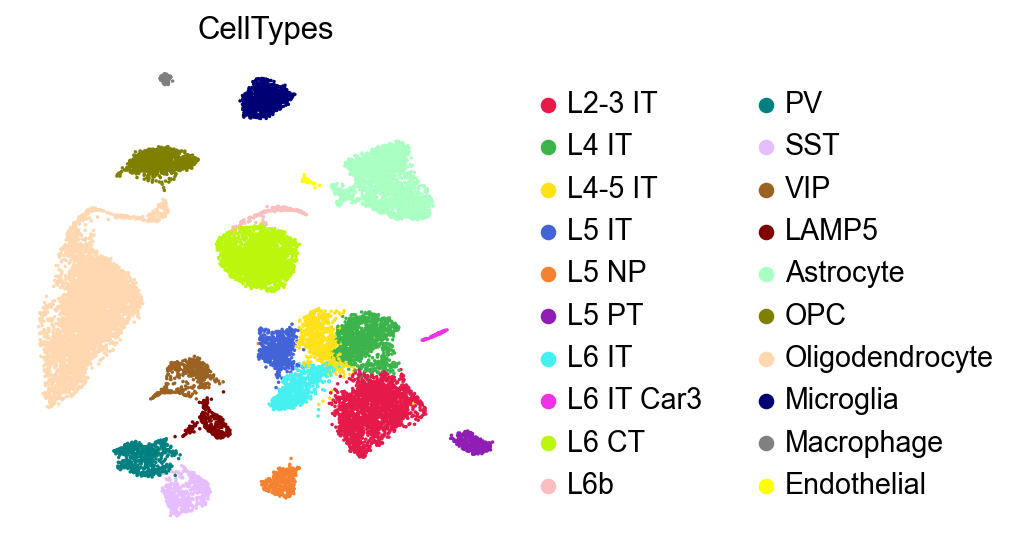
cosgMarkerDB=pd.read_csv('.../Result/single-cell/Enhancer/WholeMouseBrainRNAAllen/WholeMouseBrainRNAAllen_isocortex_subclass_leidenlocalRes0.5_markerGenes.csv', index_col=0)cosgMarkerDB.shape(32285, 201)cosgMarkerDB.head()cosgMarkerScoreDB=pd.read_csv('.../Result/single-cell/Enhancer/WholeMouseBrainRNAAllen/WholeMouseBrainRNAAllen_isocortex_subclass_leidenlocalRes0.5_markerGenesScores.csv', index_col=0)cosgMarkerScoreDB.head()import piaso.../site-packages/tqdm/auto.py:21: TqdmWarning: IProgress not found. Please update jupyter and ipywidgets. See https://ipywidgets.readthedocs.io/en/stable/user_install.html from .autonotebook import tqdm as notebook_tqdm%%timepiaso.tl.infog(adata, layer='raw')The normalized data is saved as `infog` in `adata.layers`.The highly variable genes are saved as `highly_variable` in `adata.var`.Finished INFOG normalization.CPU times: user 2.4 s, sys: 1.15 s, total: 3.55 sWall time: 3.59 sadataAnnData object with n_obs × n_vars = 17412 × 26205 obs: 'gex_barcode', 'atac_barcode', 'is_cell', 'excluded_reason', 'gex_raw_reads', 'gex_mapped_reads', 'gex_conf_intergenic_reads', 'gex_conf_exonic_reads', 'gex_conf_intronic_reads', 'gex_conf_exonic_unique_reads', 'gex_conf_exonic_antisense_reads', 'gex_conf_exonic_dup_reads', 'gex_exonic_umis', 'gex_conf_intronic_unique_reads', 'gex_conf_intronic_antisense_reads', 'gex_conf_intronic_dup_reads', 'gex_intronic_umis', 'gex_conf_txomic_unique_reads', 'gex_umis_count', 'gex_genes_count', 'atac_raw_reads', 'atac_unmapped_reads', 'atac_lowmapq', 'atac_dup_reads', 'atac_chimeric_reads', 'atac_mitochondrial_reads', 'atac_fragments', 'atac_TSS_fragments', 'atac_peak_region_fragments', 'atac_peak_region_cutsites', 'Sample', 'batch', 'n_genes', 'n_genes_by_counts', 'total_counts', 'total_counts_mt', 'pct_counts_mt', 'pct_counts_ribo', 'scrublet_score', 'predicted_doublets', 'scrublet_cluster_score', 'bh_pval', 'Leiden', 'Leiden_last', 'Leiden_last2', 'Leiden_sample', 'CellTypes_TACCO', 'Leiden_local', 'CellTypes' var: 'gene_ids', 'feature_types', 'genome', 'n_cells', 'mt', 'n_cells_by_counts', 'mean_counts', 'pct_dropout_by_counts', 'total_counts', 'means', 'variances', 'residual_variances', 'highly_variable_rank', 'highly_variable', 'highly_variable_nbatches', 'highly_variable_intersection', 'infog_var' uns: 'CellTypes_TACCO_colors', 'CellTypes_colors', 'Leiden_colors', 'Leiden_last2_colors', 'Leiden_last_colors', 'Leiden_local_colors', 'Sample_colors', 'cosg', 'dendrogram_Leiden', 'dendrogram_Leiden_local', 'hvg', 'leiden', 'log1p', 'neighbors', 'umap' obsm: 'CellTypes_TACCO', 'X_pca', 'X_pca_harmony', 'X_umap', 'X_umap_pca', 'X_umap_raw' varm: 'CellTypes_TACCO' layers: 'log1p', 'raw', 'infog' obsp: 'connectivities', 'distances'piaso.tl.predictCellTypeByMarker( adata, marker_gene_set=cosgMarkerDB[:50], ### Use the top 50 marker genes, score_method = 'piaso', score_layer = 'infog', use_score = True, max_workers = 32, smooth_prediction = True, use_rep = 'X_pca_harmony', ### Use the specified low-dimensional cell embeddings for kNN graph-based cell type prediction smoothing k_nearest_neighbors = 9, return_confidence = False, use_existing_adjacency_graph = False, use_faiss = False, key_added = 'Subclass_predicted', extract_cell_type = True, delimiter_cell_type = '-', ## Set True to extract the subclass, as now it's clusters of subclass level
inplace = True, random_seed = 1927, verbosity = 1, n_jobs = -1,)Calculating gene set scores using piaso method...Scoring gene sets: 100%|██████████| 201/201 [00:41<00:00, 4.87set/s]Predicting cell types based on marker gene scores...Smoothing cell type predictions...Smoothing cell type predictions from 'Subclass_predicted_raw' using 9-nearest neighborsSmoothed predictions stored in adata.obs['Subclass_predicted_smoothed']Modified 1141 cell labels (6.55% of total)Cell type prediction completed. Results saved to: - adata.obs['Subclass_predicted']: predicted cell types - adata.obsm['Subclass_predicted_score']: full score matrix - adata.obs['Subclass_predicted_score']: maximum scores - adata.obs['Subclass_predicted_raw']: original unsmoothed predictionssc.pl.umap(adata, color=['Subclass_predicted'], palette=piaso.pl.color.d_color10, # legend_loc='on data', legend_fontoutline=2, legend_fontweight=5, cmap='Spectral_r', ncols=3, size=10, frameon=False)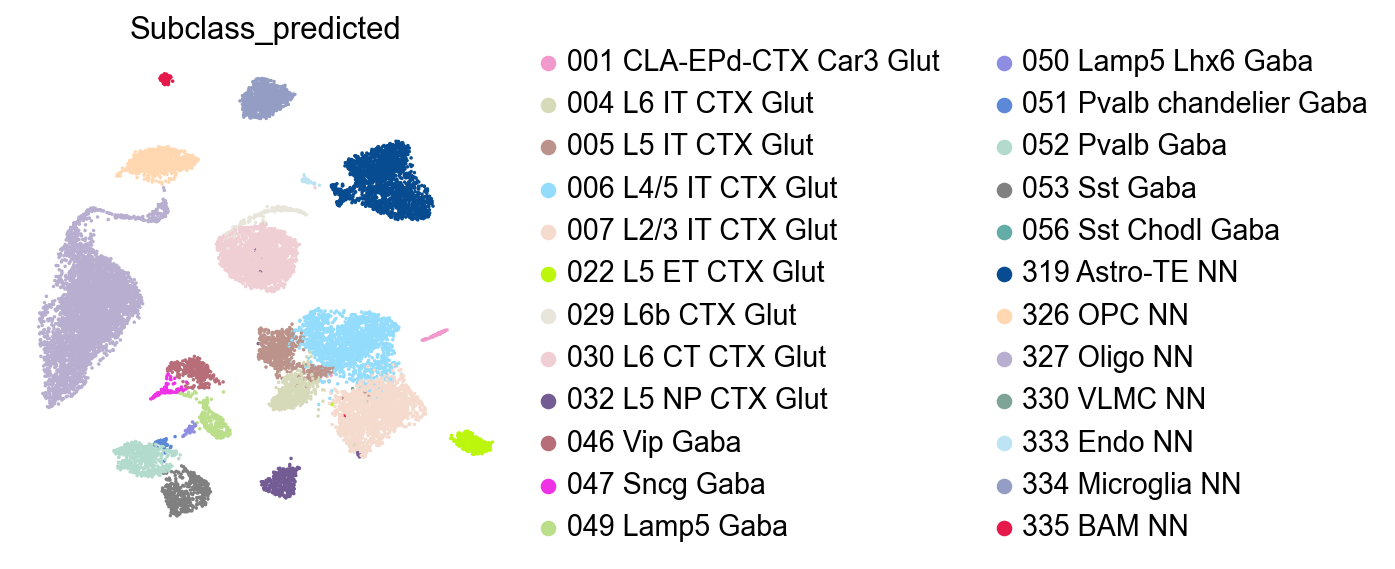
sc.pl.umap(adata, color=['CellTypes'], palette=piaso.pl.color.d_color10, legend_loc='on data', legend_fontoutline=2, legend_fontsize=6, legend_fontweight=5, # cmap='Spectral_r', cmap=sp_cmap, ncols=1, size=10, frameon=False)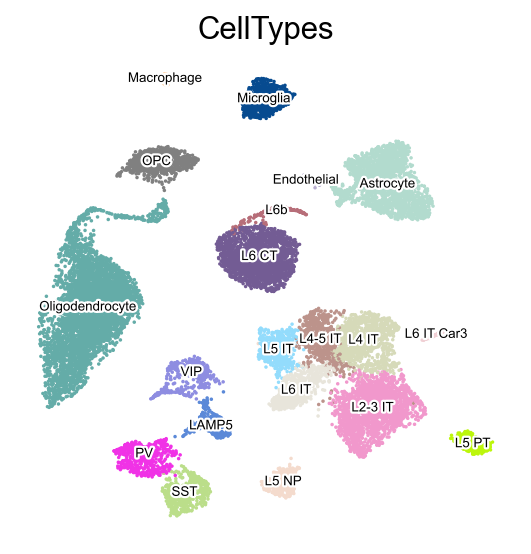
sc.pl.umap(adata,           color=['Subclass_predicted_score'],           palette=piaso.pl.color.d_color10,           # legend_loc='on data',           legend_fontoutline=2,           legend_fontweight=5,           # cmap='Spectral_r',           cmap=piaso.pl.color.c_color6,
           ncols=1,           size=10,           frameon=False)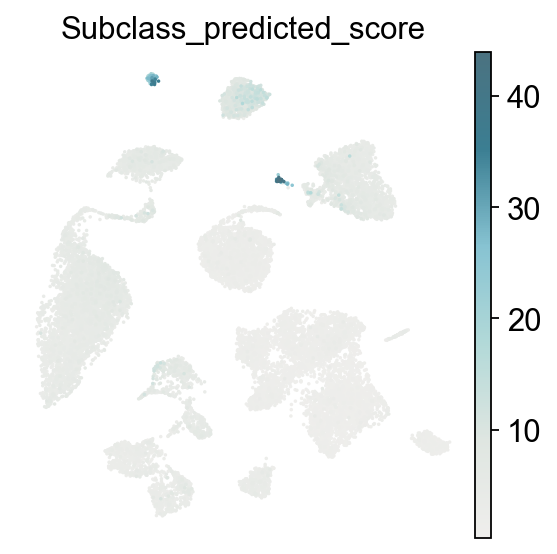
piaso.tl.predictCellTypeByMarker(    adata,    marker_gene_set=cosgMarkerDB[:50], ### Use the top 50 marker genes,    score_method = 'piaso',    score_layer = 'infog',    use_score  = False,    max_workers = 32,    smooth_prediction = True,    use_rep = 'X_pca_harmony', ### Use the specified low-dimensional cell embeddings for kNN graph-based cell type prediction smoothing    k_nearest_neighbors = 9,    return_confidence  = False,    use_existing_adjacency_graph = False,    use_faiss = False,    key_added  = 'Subclass_predicted_pvals',    extract_cell_type  = True, delimiter_cell_type  = '-', ## Set True to extract the subclass, as now it's clusters of subclass level
    inplace  = True,    random_seed = 1927,    verbosity = 1,    n_jobs  = -1,)
Calculating gene set scores using piaso method...Scoring gene sets: 100%|██████████| 201/201 [00:45<00:00, 4.42set/s]Predicting cell types based on marker gene p-values...Smoothing cell type predictions...Smoothing cell type predictions from 'Subclass_predicted_pvals_raw' using 9-nearest neighborsSmoothed predictions stored in adata.obs['Subclass_predicted_pvals_smoothed']Modified 1372 cell labels (7.88% of total)Cell type prediction completed. Results saved to: - adata.obs['Subclass_predicted_pvals']: predicted cell types - adata.obsm['Subclass_predicted_pvals_score']: full score matrix - adata.obsm['Subclass_predicted_pvals_nlog10pvals']: full -log10(p-value) matrix - adata.obs['Subclass_predicted_pvals_nlog10pvals']: maximum -log10(p-values) - adata.obs['Subclass_predicted_pvals_raw']: original unsmoothed predictionssc.pl.umap(adata, color=['Subclass_predicted', 'Subclass_predicted_pvals'], palette=piaso.pl.color.d_color10, # legend_loc='on data', legend_fontoutline=2, legend_fontweight=5, cmap='Spectral_r', ncols=1, size=10, frameon=False)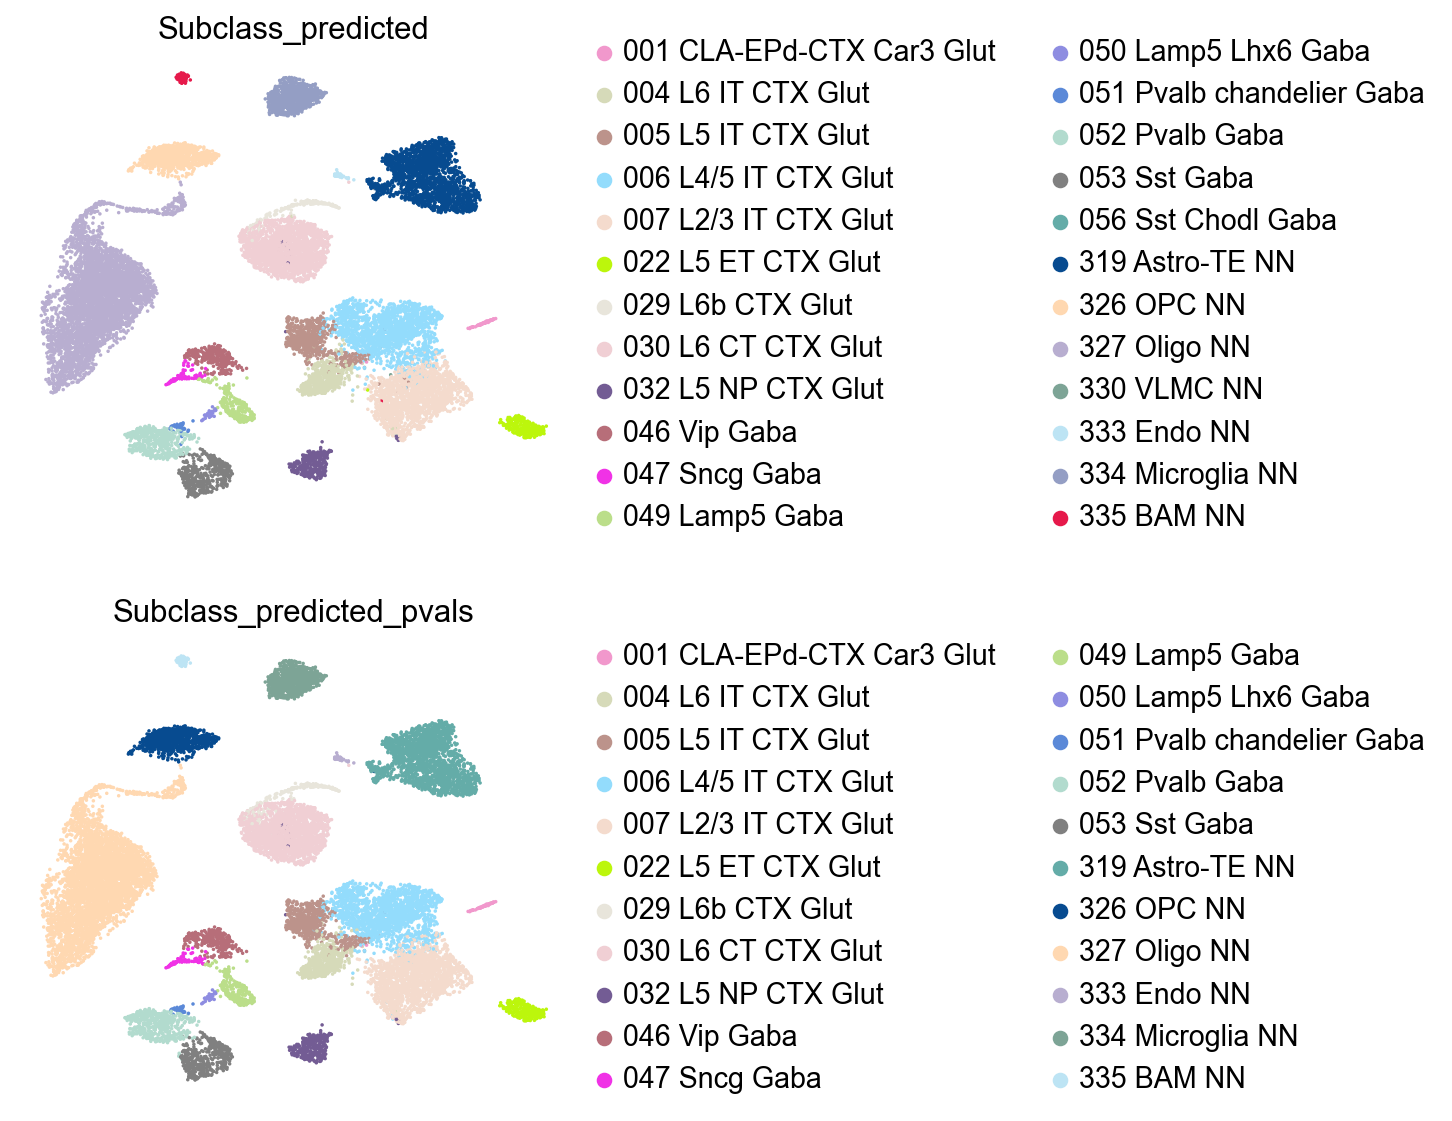
sc.pl.umap(adata, color=['CellTypes'], palette=piaso.pl.color.d_color10, legend_loc='on data', legend_fontoutline=2, legend_fontsize=6, legend_fontweight=5, # cmap='Spectral_r', cmap=sp_cmap, ncols=1, size=10, frameon=False)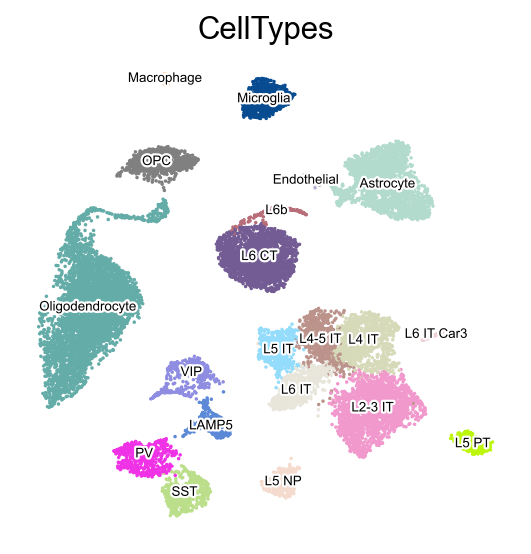
sc.pl.umap(adata,           color=['Subclass_predicted_pvals_nlog10pvals'],           palette=piaso.pl.color.d_color10,           # legend_loc='on data',           legend_fontoutline=2,           legend_fontweight=5,           # cmap='Spectral_r',           cmap=piaso.pl.color.c_color6,           vcenter= -np.log10(0.05), vmin=0,
           ncols=1,           size=10,           frameon=False)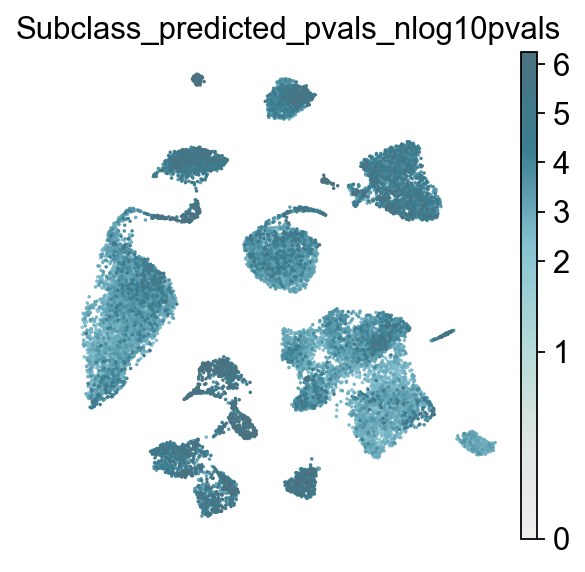
sc.pl.umap(adata, color=['Sample', 'Leiden'], palette=self_palette2, # legend_loc='on data', legend_fontoutline=2, legend_fontweight=5, # cmap='Spectral_r', cmap=sp_cmap, ncols=1, size=10, frameon=False)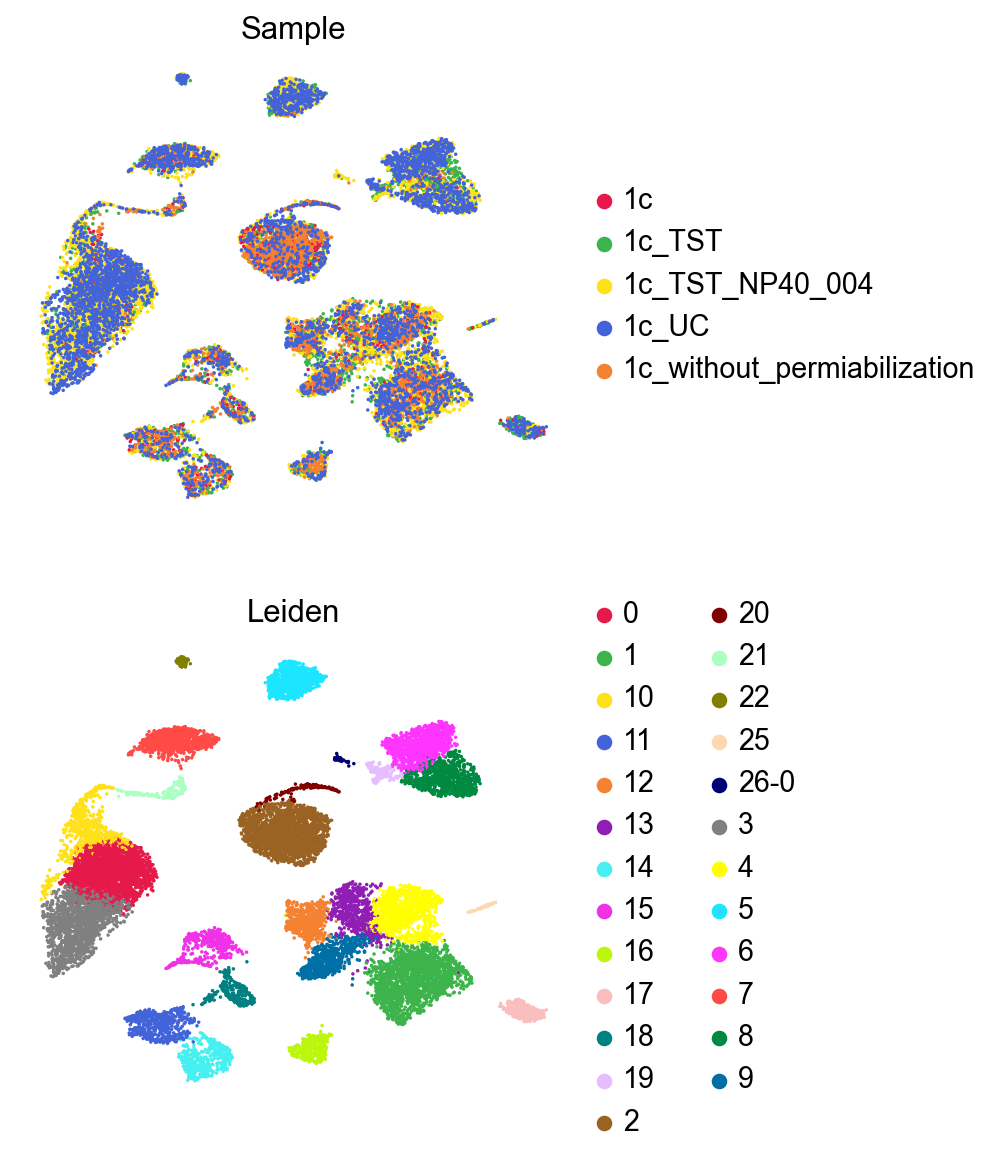
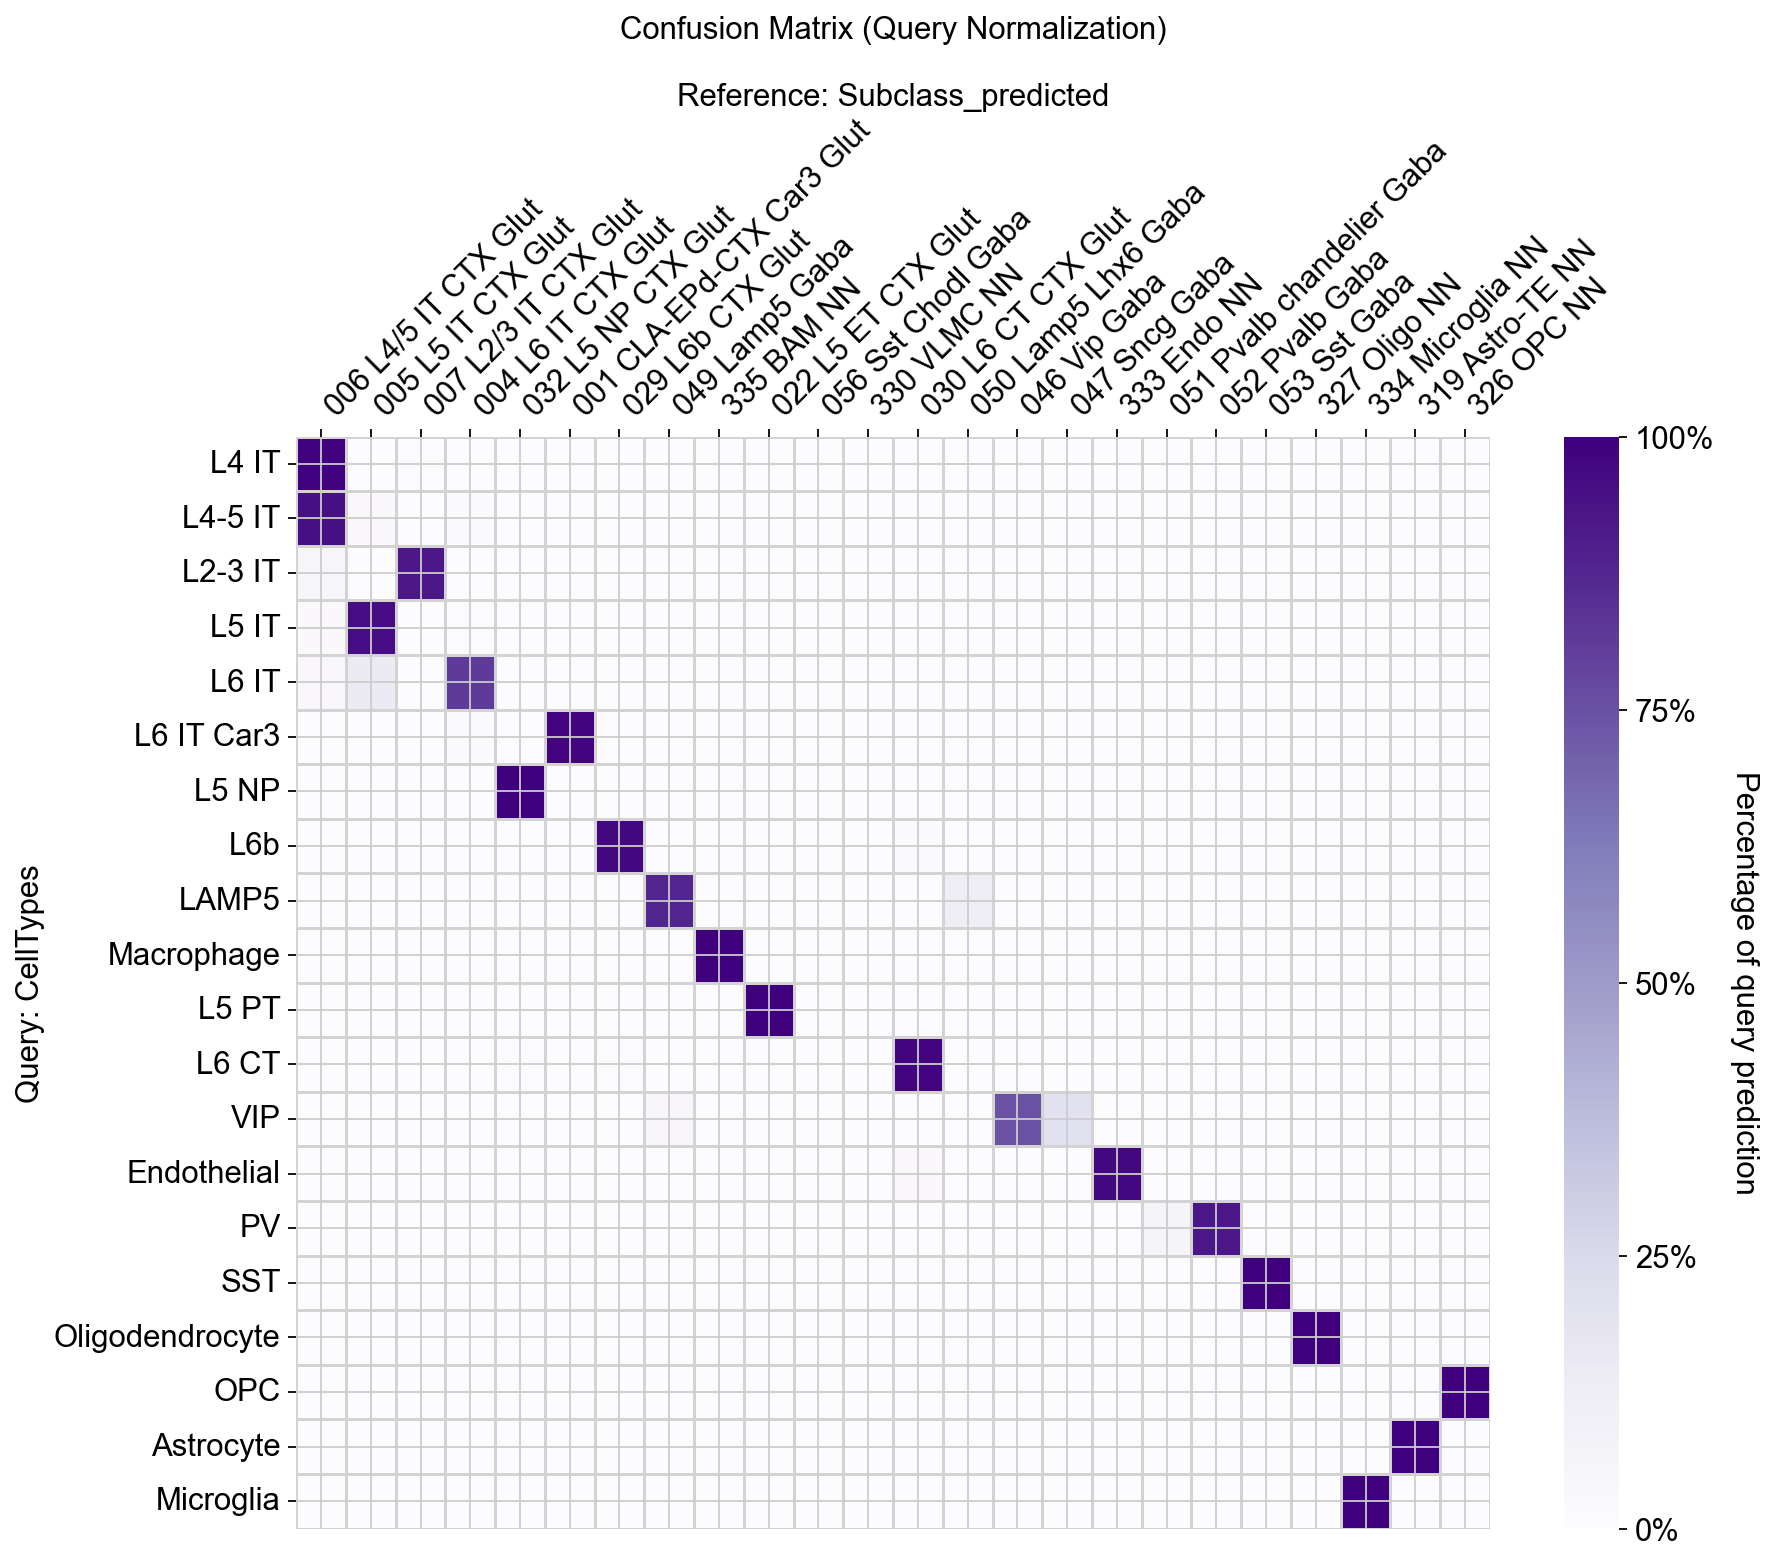
piaso.pl.plotConfusionMatrix(adata, 'CellTypes', 'Subclass_predicted',)