Running SCALAR on human cortex snRNA-seq data for ligand-receptor interaction analysis
Running SCALAR on human cortex snRNA-seq data for ligand-receptor interaction analysis
import piaso.../site-packages/tqdm/auto.py:21: TqdmWarning: IProgress not found. Please update jupyter and ipywidgets. See https://ipywidgets.readthedocs.io/en/stable/user_install.html from .autonotebook import tqdm as notebook_tqdmimport numpy as npimport pandas as pdimport scanpy as scsc.set_figure_params(dpi=80,dpi_save=300, color_map='viridis',facecolor='white')from matplotlib import rcParams# To modify the default figure size, use rcParams.rcParams['figure.figsize'] = 4, 4rcParams['font.sans-serif'] = "Arial"rcParams['font.family'] = "Arial"sc.settings.verbosity = 3sc.logging.print_header()/tmp/ipykernel_4124333/1353975569.py:11: RuntimeWarning: Failed to import dependencies for application/vnd.jupyter.widget-view+json representation. (ModuleNotFoundError: No module named 'ipywidgets') sc.logging.print_header()| Dependency | Version || ------------------ | ------------------- || natsort | 8.4.0 || python-dateutil | 2.9.0.post0 || tornado | 6.5.4 || llvmlite | 0.46.0 || networkx | 3.4.2 || kiwisolver | 1.4.9 || texttable | 1.7.0 || six | 1.17.0 || h5py | 3.15.1 || setuptools | 80.9.0 || prompt_toolkit | 3.0.52 || charset-normalizer | 3.4.4 || patsy | 1.0.2 || pure_eval | 0.2.3 || asttokens | 3.0.0 || cycler | 0.12.1 || jedi | 0.19.2 || tqdm | 4.67.1 || executing | 2.2.1 || joblib | 1.5.3 || parso | 0.8.5 || igraph | 0.11.9 || pytz | 2025.2 |... [19 more lines]save_dir='.../Result/single-cell/Methods/PIASO'sc.settings.figdir = save_dirprefix='SEAAD_SCALAR_CCI_tutorial'import osif not os.path.exists(save_dir): os.makedirs(save_dir)
sc.set_figure_params(dpi=80,dpi_save=300, color_map='viridis',facecolor='white')rcParams['figure.figsize'] = 4, 4adata=sc.read('.../Result/single-cell/Enhancer/SEA-AD/SEA-AD_RNA_MTG_subsample_excludeReference_20k_piaso.h5ad')adataAnnData object with n_obs × n_vars = 20000 × 36601 obs: 'sample_id', 'Neurotypical reference', 'Donor ID', 'Organism', 'Brain Region', 'Sex', 'Gender', 'Age at Death', 'Race (choice=White)', 'Race (choice=Black/ African American)', 'Race (choice=Asian)', 'Race (choice=American Indian/ Alaska Native)', 'Race (choice=Native Hawaiian or Pacific Islander)', 'Race (choice=Unknown or unreported)', 'Race (choice=Other)', 'specify other race', 'Hispanic/Latino', 'Highest level of education', 'Years of education', 'PMI', 'Fresh Brain Weight', 'Brain pH', 'Overall AD neuropathological Change', 'Thal', 'Braak', 'CERAD score', 'Overall CAA Score', 'Highest Lewy Body Disease', 'Total Microinfarcts (not observed grossly)', 'Total microinfarcts in screening sections', 'Atherosclerosis', 'Arteriolosclerosis', 'LATE', 'Cognitive Status', 'Last CASI Score', 'Interval from last CASI in months', 'Last MMSE Score', 'Interval from last MMSE in months', 'Last MOCA Score', 'Interval from last MOCA in months', 'APOE Genotype', 'Primary Study Name', 'Secondary Study Name', 'NeuN positive fraction on FANS', 'RIN', 'cell_prep_type', 'facs_population_plan', 'rna_amplification', 'sample_name', 'sample_quantity_count', 'expc_cell_capture', 'method', 'pcr_cycles', 'percent_cdna_longer_than_400bp', 'rna_amplification_pass_fail', 'amplified_quantity_ng', 'load_name', 'library_prep', 'library_input_ng', 'r1_index', 'avg_size_bp', 'quantification_fmol', 'library_prep_pass_fail', 'exp_component_vendor_name', 'batch_vendor_name', 'experiment_component_failed', 'alignment', 'Genome', 'ar_id', 'bc', 'GEX_Estimated_number_of_cells', 'GEX_number_of_reads', 'GEX_sequencing_saturation', 'GEX_Mean_raw_reads_per_cell', 'GEX_Q30_bases_in_barcode', 'GEX_Q30_bases_in_read_2', 'GEX_Q30_bases_in_UMI', 'GEX_Percent_duplicates', 'GEX_Q30_bases_in_sample_index_i1', 'GEX_Q30_bases_in_sample_index_i2', 'GEX_Reads_with_TSO', 'GEX_Sequenced_read_pairs', 'GEX_Valid_UMIs', 'GEX_Valid_barcodes', 'GEX_Reads_mapped_to_genome', 'GEX_Reads_mapped_confidently_to_genome', 'GEX_Reads_mapped_confidently_to_intergenic_regions', 'GEX_Reads_mapped_confidently_to_intronic_regions', 'GEX_Reads_mapped_confidently_to_exonic_regions', 'GEX_Reads_mapped_confidently_to_transcriptome', 'GEX_Reads_mapped_antisense_to_gene', 'GEX_Fraction_of_transcriptomic_reads_in_cells', 'GEX_Total_genes_detected', 'GEX_Median_UMI_counts_per_cell', 'GEX_Median_genes_per_cell', 'Multiome_Feature_linkages_detected', 'Multiome_Linked_genes', 'Multiome_Linked_peaks', 'ATAC_Confidently_mapped_read_pairs', 'ATAC_Fraction_of_genome_in_peaks', 'ATAC_Fraction_of_high_quality_fragments_in_cells', 'ATAC_Fraction_of_high_quality_fragments_overlapping_TSS', 'ATAC_Fraction_of_high_quality_fragments_overlapping_peaks', 'ATAC_Fraction_of_transposition_events_in_peaks_in_cells', 'ATAC_Mean_raw_read_pairs_per_cell', 'ATAC_Median_high_quality_fragments_per_cell', 'ATAC_Non-nuclear_read_pairs', 'ATAC_Number_of_peaks', 'ATAC_Percent_duplicates', 'ATAC_Q30_bases_in_barcode', 'ATAC_Q30_bases_in_read_1', 'ATAC_Q30_bases_in_read_2', 'ATAC_Q30_bases_in_sample_index_i1', 'ATAC_Sequenced_read_pairs', 'ATAC_TSS_enrichment_score', 'ATAC_Unmapped_read_pairs', 'ATAC_Valid_barcodes', 'Number of mapped reads', 'Number of unmapped reads', 'Number of multimapped reads', 'Number of reads', 'Number of UMIs', 'Genes detected', 'Doublet score', 'Fraction mitochondrial UMIs', 'Used in analysis', 'Class confidence', 'Class', 'Subclass confidence', 'Subclass', 'Supertype confidence', 'Supertype (non-expanded)', 'Supertype', 'Continuous Pseudo-progression Score', 'Severely Affected Donor' var: 'gene_ids' uns: 'APOE4 Status_colors', 'Braak_colors', 'CERAD score_colors', 'Cognitive Status_colors', 'Great Apes Metadata', 'Highest Lewy Body Disease_colors', 'LATE_colors', 'Overall AD neuropathological Change_colors', 'Sex_colors', 'Subclass_colors', 'Supertype_colors', 'Thal_colors', 'UW Clinical Metadata', 'X_normalization', 'batch_condition', 'default_embedding', 'neighbors', 'title', 'umap' obsm: 'X_scVI', 'X_umap' layers: 'UMIs' obsp: 'connectivities', 'distances'sc.pl.embedding(adata, basis='X_umap', color=['Subclass'], palette=piaso.pl.color.d_color3, legend_fontoutline=2, legend_fontweight=5, cmap='Spectral_r', ncols=3, size=10, frameon=False)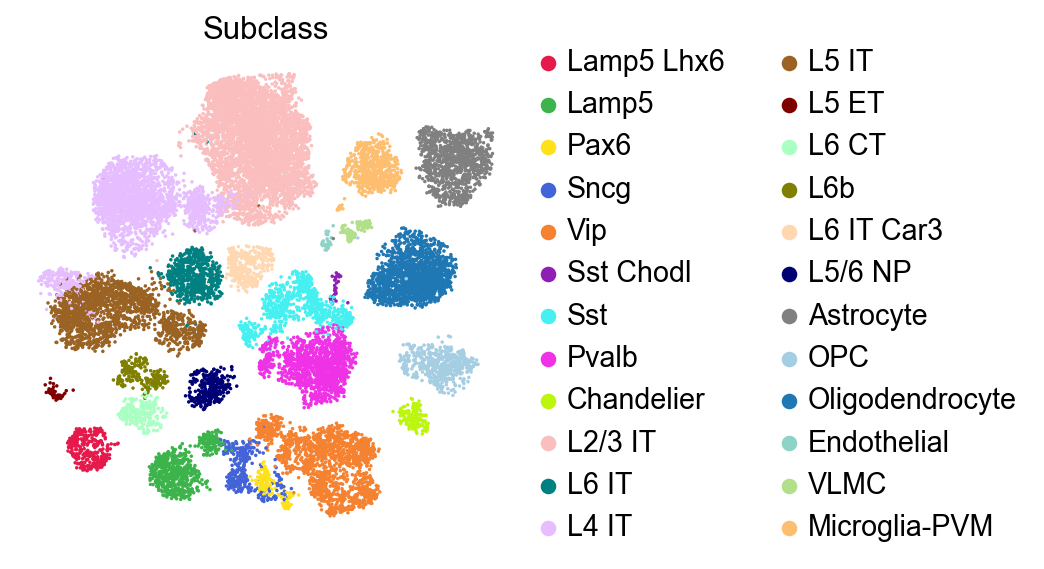
sc.pl.embedding(adata, basis='X_umap', color=['Subclass'], palette=piaso.pl.color.d_color3, legend_fontoutline=2, legend_fontsize=7, legend_fontweight=5, legend_loc='on data', cmap='Spectral_r', ncols=3, size=10, frameon=False)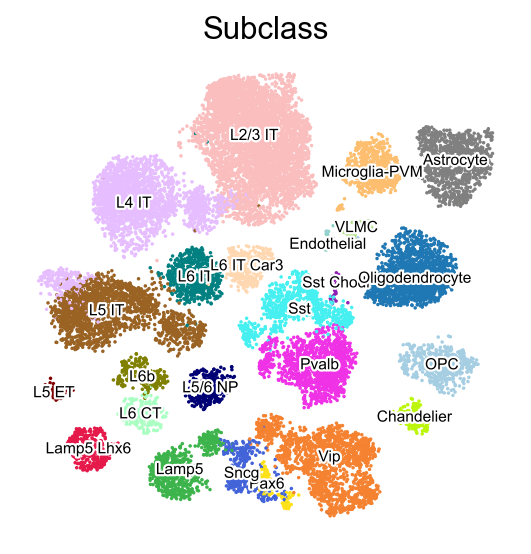
import cosgadata.X.dataarray([0.8813792 , 2.510722 , 0.8813792 , ..., 0.37347588, 0.37347588, 1.1829159 ], shape=(110359029,), dtype=float32)%%timegroupby='Subclass'cosg.cosg(adata, key_added='cosg', # use_raw=False, layer='log1p', ## e.g., if you want to use the log1p layer in adata mu=100, expressed_pct=0.05, remove_lowly_expressed=True, n_genes_user=adata.n_vars, ### Use all the genes, to enable the calculation of transformed COSG scores # n_genes_user=100, groupby=groupby, return_by_group=True, verbosity=1)Finished identifying marker genes by COSG, and the results are in adata.uns['cosg'].CPU times: user 6.62 s, sys: 1.08 s, total: 7.69 sWall time: 7.72 scosg_scores=cosg.indexByGene( adata.uns['cosg']['COSG'], # gene_key="names", score_key="scores", set_nan_to_zero=True, convert_negative_one_to_zero=True)cosg_scores=cosg.iqrLogNormalize(cosg_scores)cosg_scores### Load the mouse version# cellchatdb=pd.read_csv('.../')### Load the human versioncellchatdb=pd.read_csv('.../')cellchatdb.head()pd.Series(cellchatdb['annotation']).value_counts().head(30)annotationSecreted Signaling 1211Non-protein Signaling 749ECM-Receptor 515Cell-Cell Contact 476Name: count, dtype: int64pd.Series(cellchatdb['pathway_name']).value_counts().head(30)pathway_nameGlutamate 222COLLAGEN 221WNT 192LAMININ 165GABA-A 1085-HT 85CCL 66FGF 60Ach 58BMP 57MHC-I 51THBS 40EPHA 36TENASCIN 36SEMA3 35PARs 35IFN-I 34CXCL 33NRXN 32SLURP 32ncWNT 31Adrenaline 27ADGRL 25RA 24... [7 more lines]# # cellchatdb=cellchatdb.loc[:,['ligand', 'receptor', 'pathway_name']].copy()cellchatdb=cellchatdb.loc[:,['ligand', 'receptor', 'annotation']].copy()%%timespecific_interactions_cellchat = piaso.tl.runSCALAR( adata=adata, specificity_matrix=cosg_scores, lr_pairs=cellchatdb, ligand_col = 'ligand', receptor_col = 'receptor', annotation_col='annotation', sender_cell_types=list(adata.obs['Subclass'].cat.categories.values), receiver_cell_types=list(adata.obs['Subclass'].cat.categories.values), n_permutations=1000, n_nearest_neighbors=30, chunk_size=500000, random_seed=42)--- Step 1: Validating inputs and filtering LR pairs ---Filtered out 14 LR pairs that were not found in both the AnnData object and the specificity matrix.
--- Step 2: Calculating all observed interaction scores ---Found 1691712 potential interactions to test.
--- Step 3: Preparing background gene set for permutation testing ---Preparing background gene set by calculating mean and variance for all genes...Building KDTree to find 30 nearest neighbors for each gene...Finished preparing background gene set.
--- Step 4: Calculating p-values via 1000 permutations (vectorized) ---Processing cell type pairs: 100%|██████████| 576/576 [00:55<00:00, 10.33it/s]--- Step 5: Applying FDR (Benjamini/Hochberg) correction per cell-type pair ---FDR Correction: 100%|██████████| 576/576 [00:01<00:00, 325.56it/s]Analysis complete.CPU times: user 1min 3s, sys: 1.68 s, total: 1min 4sWall time: 1min 5sspecific_interactions_cellchatpd.Series(specific_interactions_cellchat['nlog10_p_value_fdr']>-np.log10(0.2)).value_counts()nlog10_p_value_fdrFalse 1655922True 35790Name: count, dtype: int64pd.Series(specific_interactions_cellchat['nlog10_p_value_fdr']>-np.log10(0.05)).value_counts()nlog10_p_value_fdrFalse 1677660True 14052Name: count, dtype: int64specific_interactions_cellchat['CellTypeXCellType']=piaso.pp.getCrossCategories(specific_interactions_cellchat, 'sender', 'receiver')specific_interactions_cellchat['CellTypeXCellType']=specific_interactions_cellchat['CellTypeXCellType'].astype('str')specific_interactions_cellchat['ligandXreceptor']=piaso.pp.getCrossCategories(specific_interactions_cellchat, 'ligand', 'receptor', delimiter='-->')specific_interactions_cellchat['ligandXreceptor']=specific_interactions_cellchat['ligandXreceptor'].astype('str')specific_interactions_cellchat.head()len(specific_interactions_cellchat['CellTypeXCellType'].unique())576adata.obs['Subclass'].cat.categoriesIndex(['Lamp5 Lhx6', 'Lamp5', 'Pax6', 'Sncg', 'Vip', 'Sst Chodl', 'Sst', 'Pvalb', 'Chandelier', 'L2/3 IT', 'L6 IT', 'L4 IT', 'L5 IT', 'L5 ET', 'L6 CT', 'L6b', 'L6 IT Car3', 'L5/6 NP', 'Astrocyte', 'OPC', 'Oligodendrocyte', 'Endothelial', 'VLMC', 'Microglia-PVM'], dtype='object')si_fdr=specific_interactions_cellchat[specific_interactions_cellchat['nlog10_p_value_fdr']>-np.log10(0.5)].copy()piaso.pl.plotLigandReceptorInteraction( interactions_df=si_fdr, specificity_df=cosg_scores, cell_type_pairs=['L5 ET@Sst', 'L5/6 NP@Sst', 'L5 ET@Pvalb', 'L5/6 NP@Pvalb',], ligand_receptor_sep='-->', top_n=50, y_max=10, heatmap_cmap='Purples', shared_legend=True)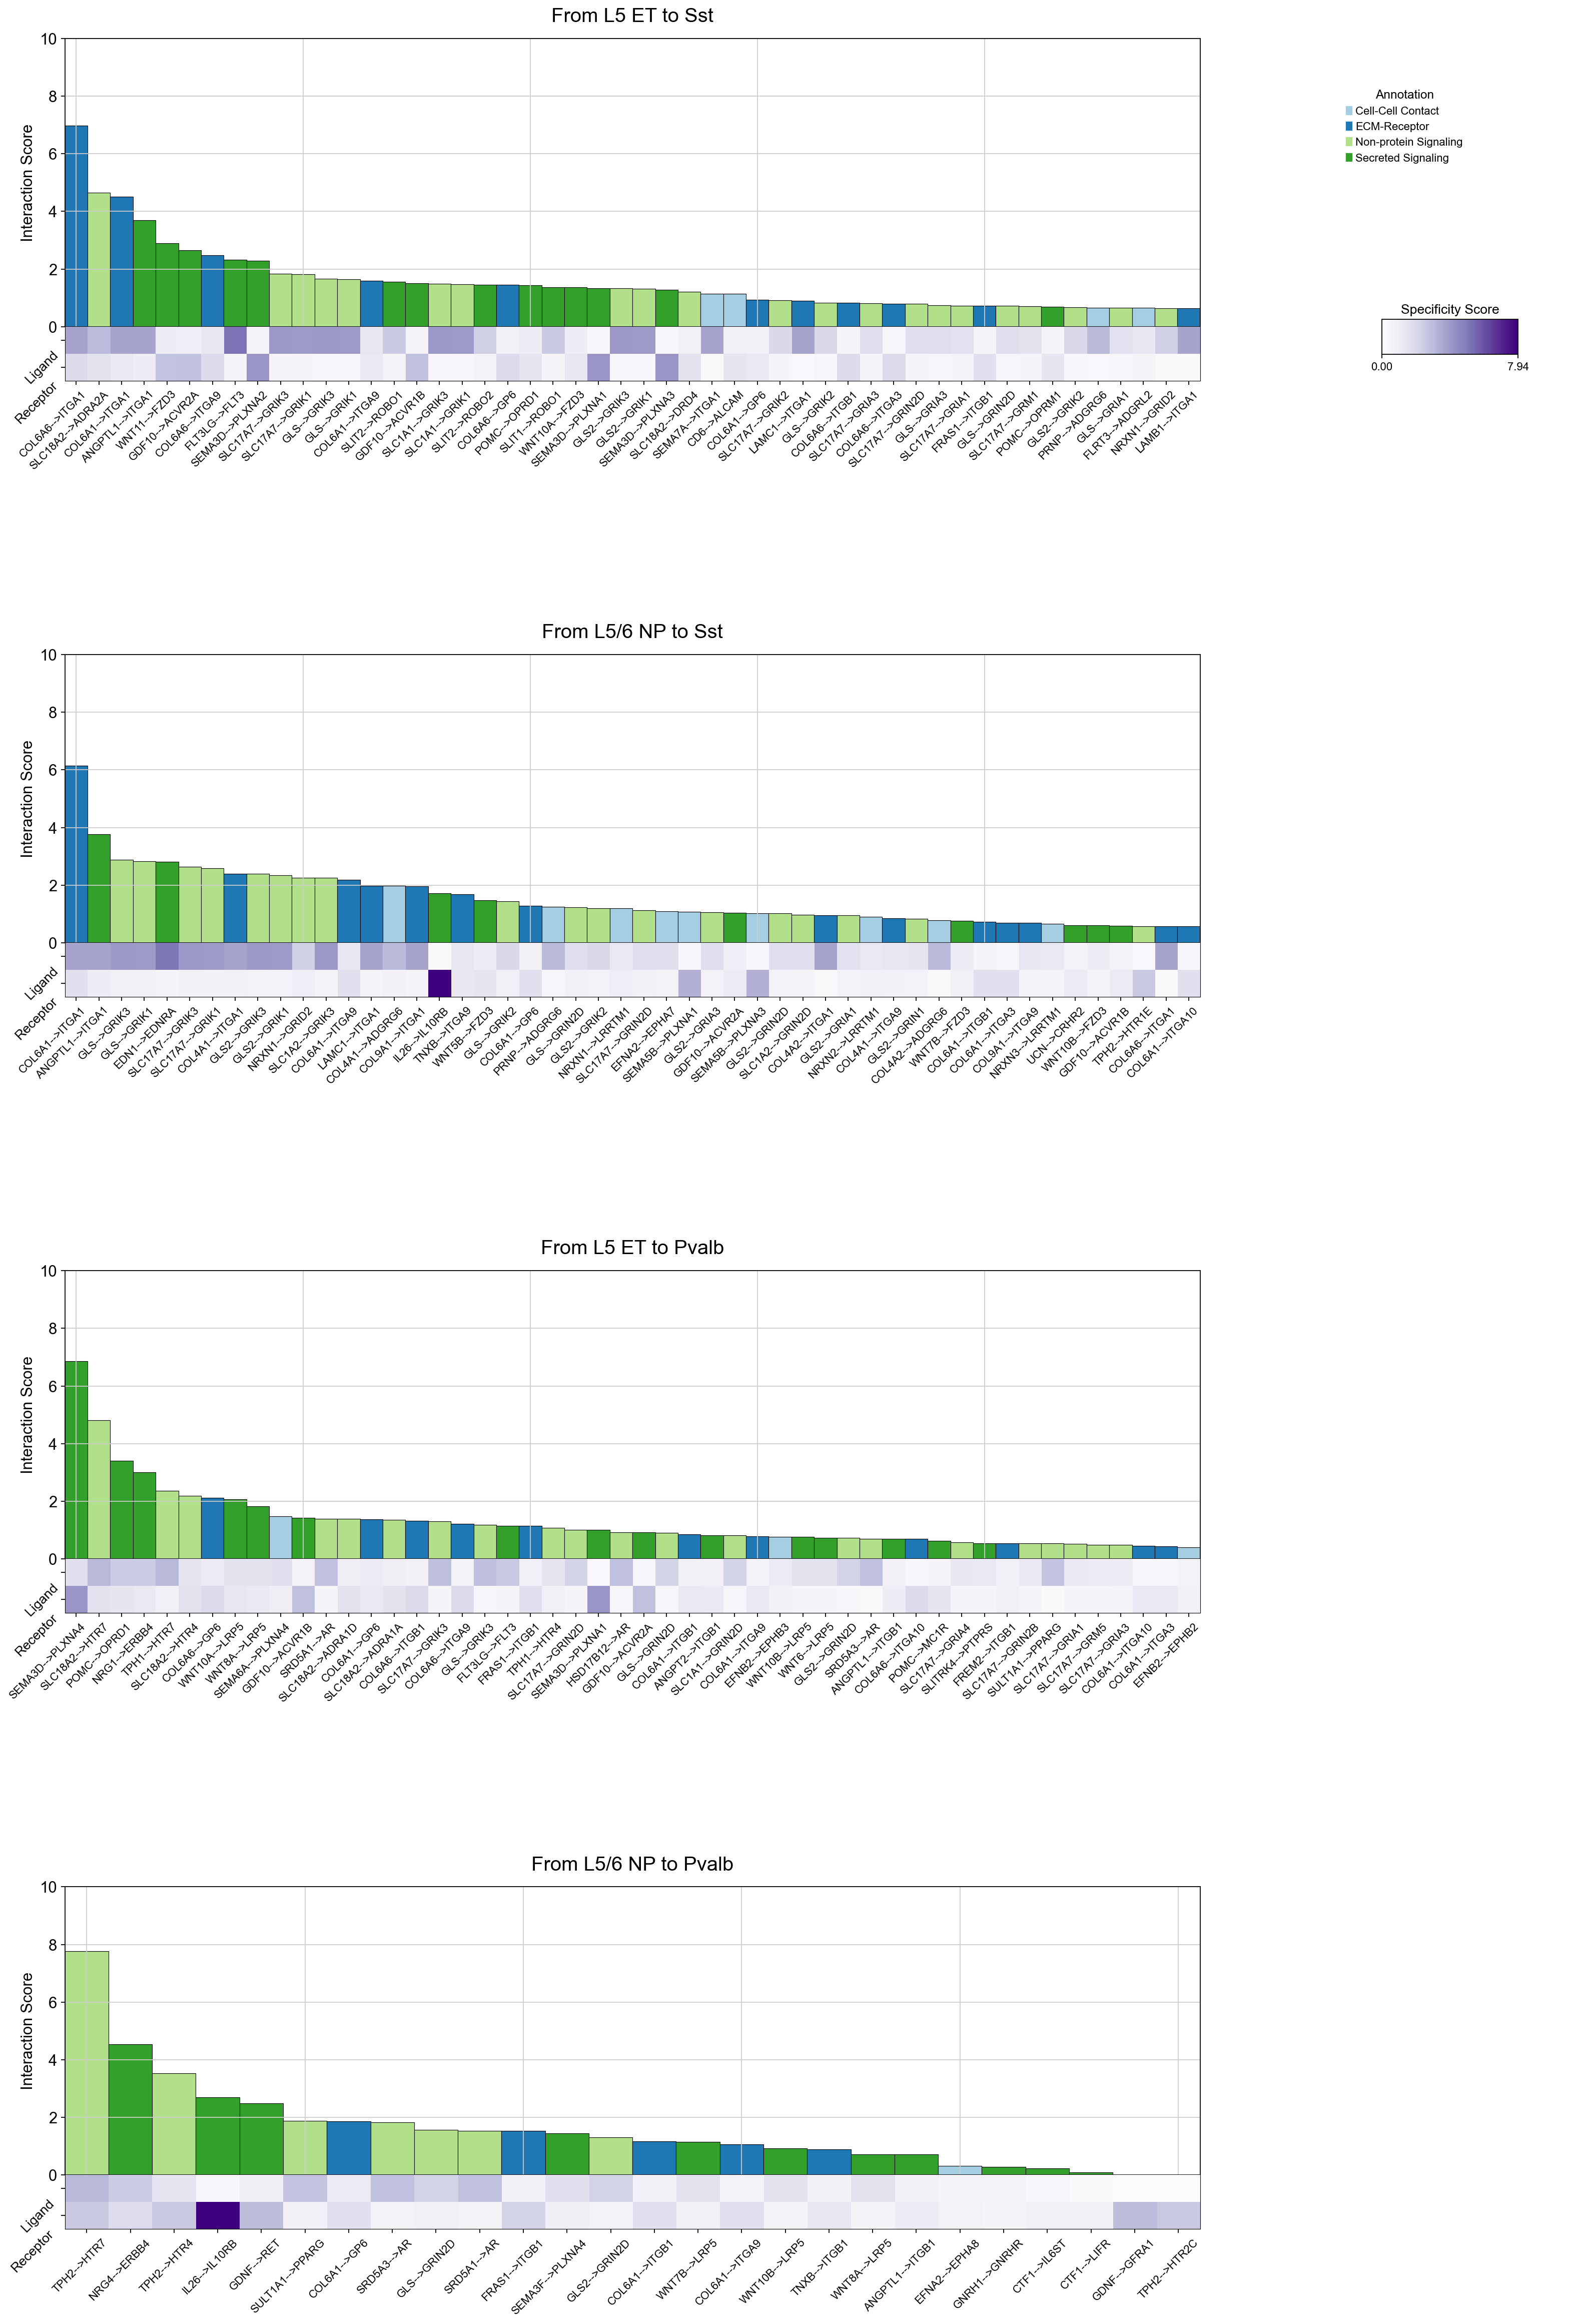
# specific_interactions_subset=specific_interactions.loc[#     specific_interactions['annotation'].isin(['Secreted Signaling'])# ]
specific_interactions_cellchat_subset=specific_interactions_cellchat.loc[    specific_interactions_cellchat['annotation'].isin(['ECM-Receptor'])]

# specific_interactions_subset=specific_interactions.loc[#     specific_interactions['annotation'].isin(['Cell-Cell Contact'])# ]

# specific_interactions_cellchat_subset=specific_interactions_cellchat.loc[# specific_interactions_cellchat['annotation'].isin(['Non-protein Signaling'])# ]piaso.pl.plotLigandReceptorInteraction( interactions_df=specific_interactions_cellchat_subset, specificity_df=cosg_scores, cell_type_pairs=['L5 ET@Sst', 'L5/6 NP@Sst', 'L5 ET@Pvalb', 'L5/6 NP@Pvalb',], ligand_receptor_sep='-->', top_n=50, y_max=10, heatmap_cmap='Purples', fig_height_per_pair=6, fig_width=20, shared_legend=True)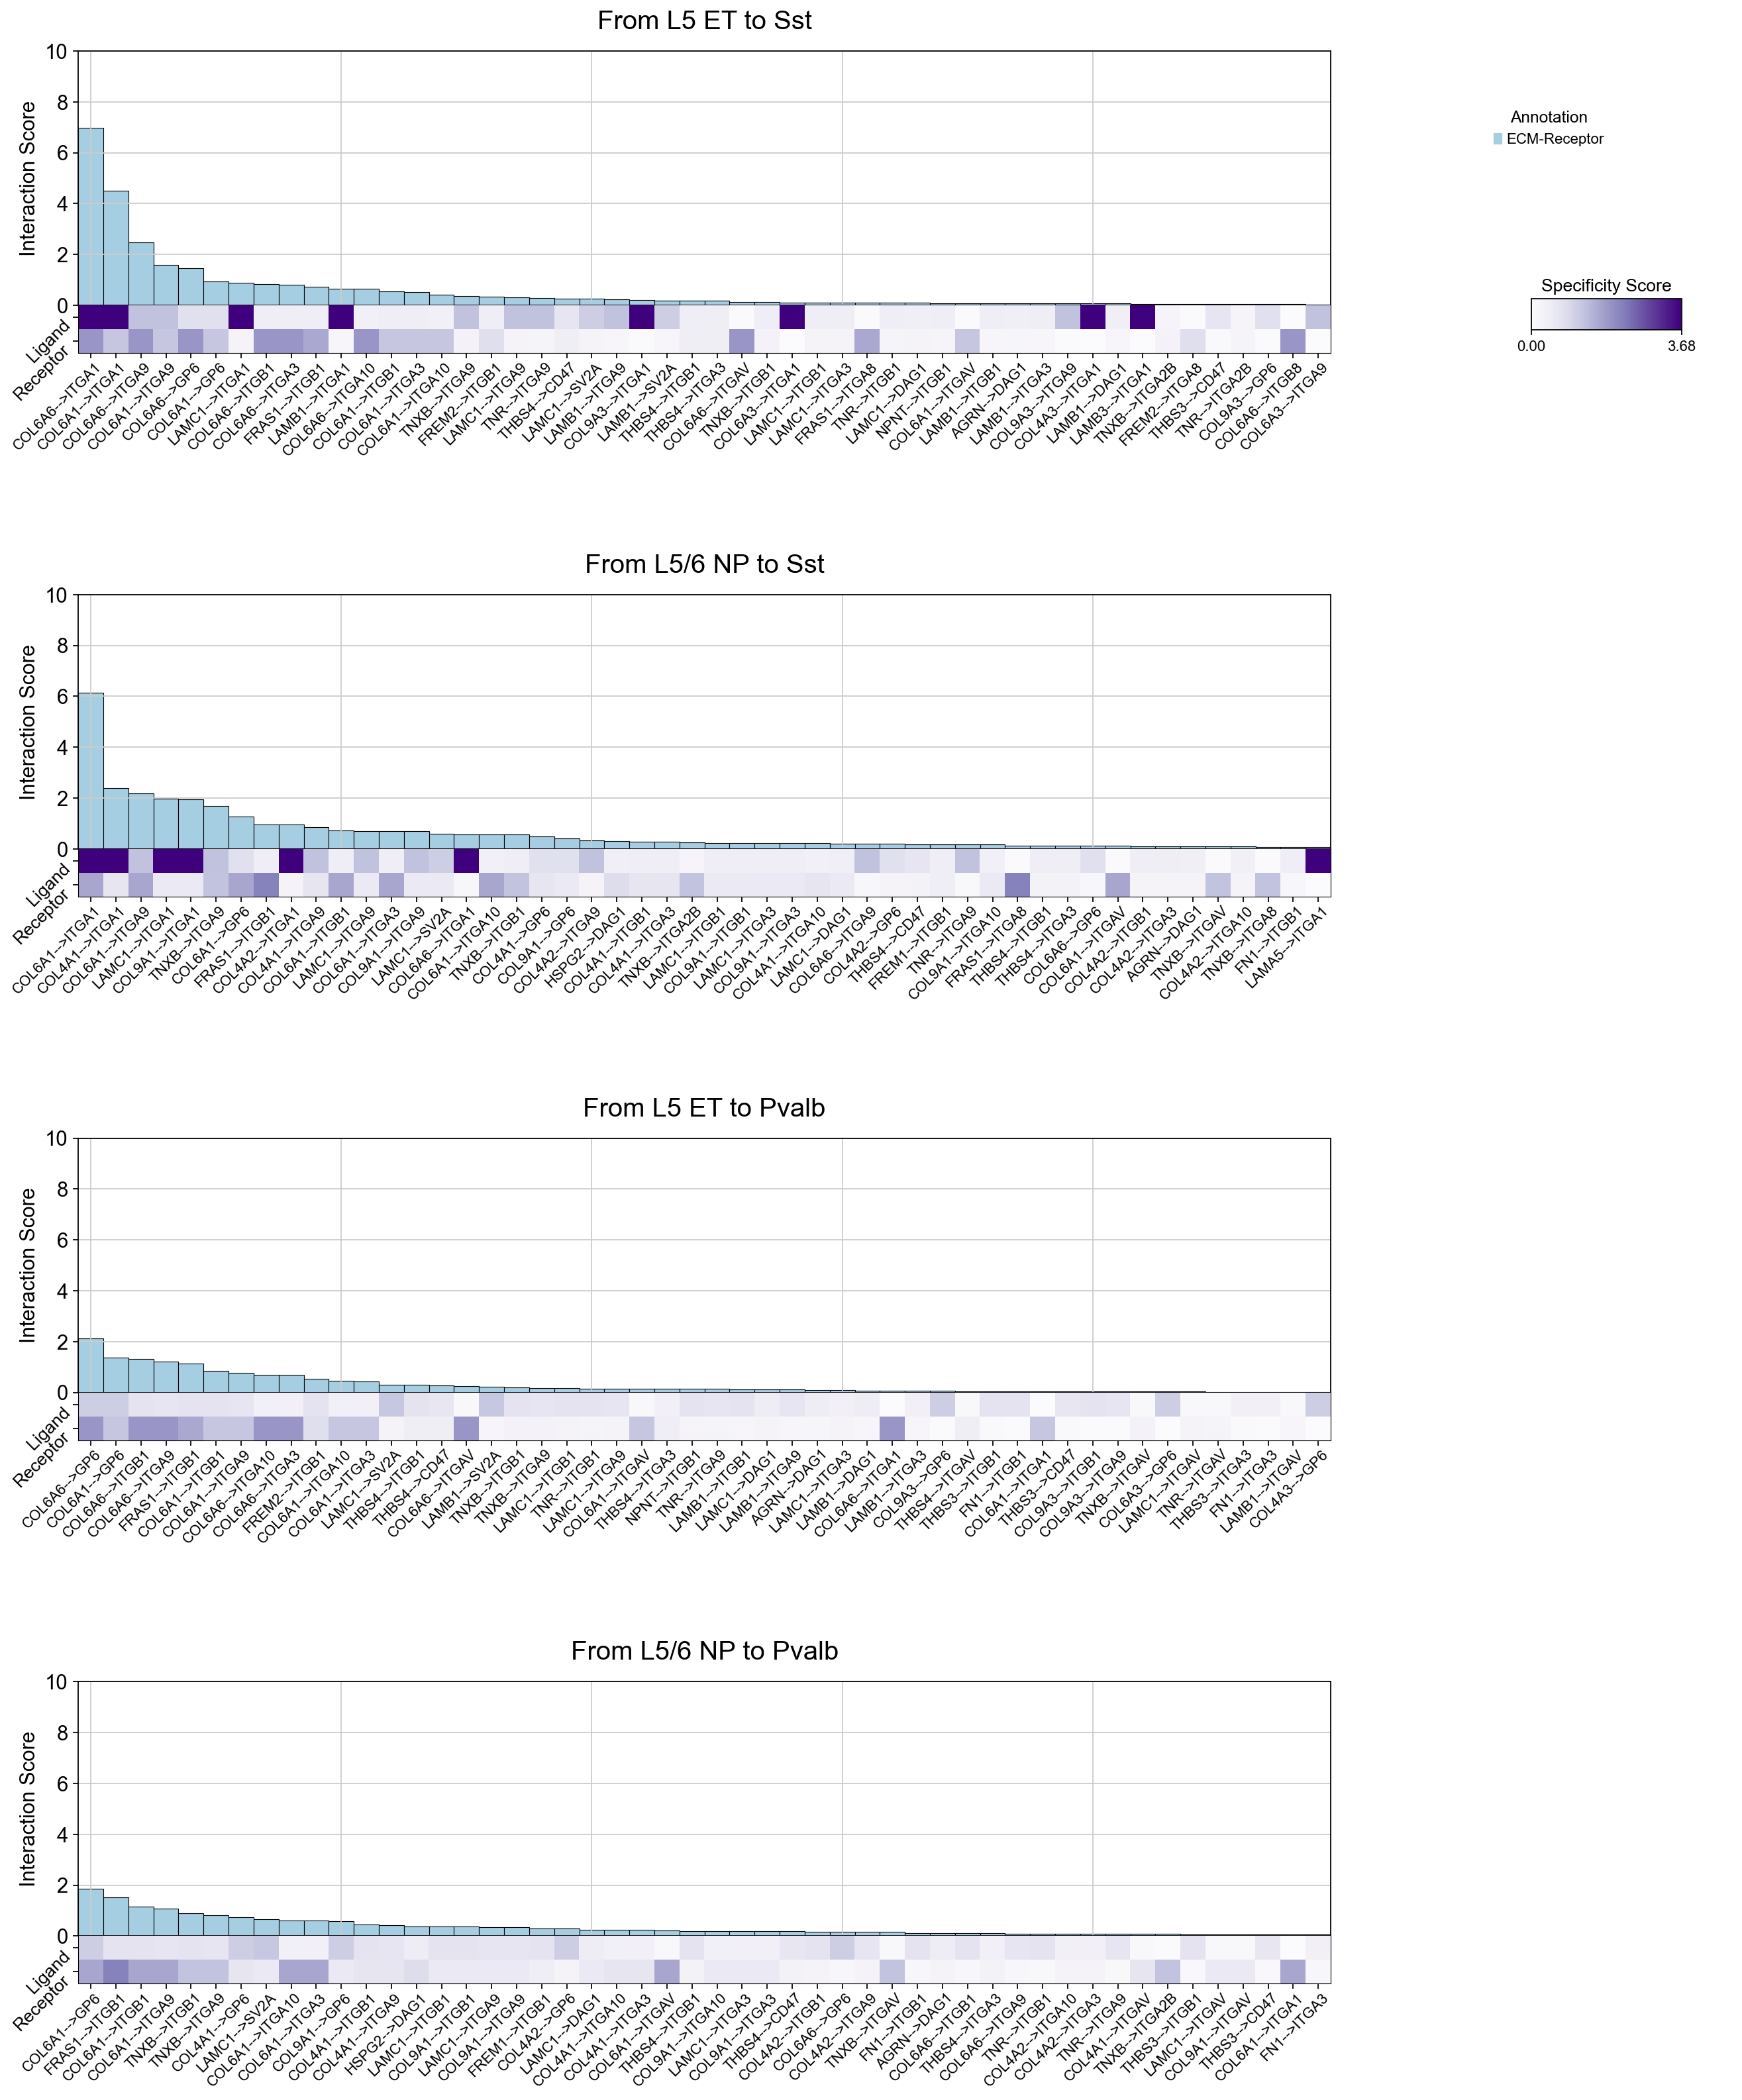
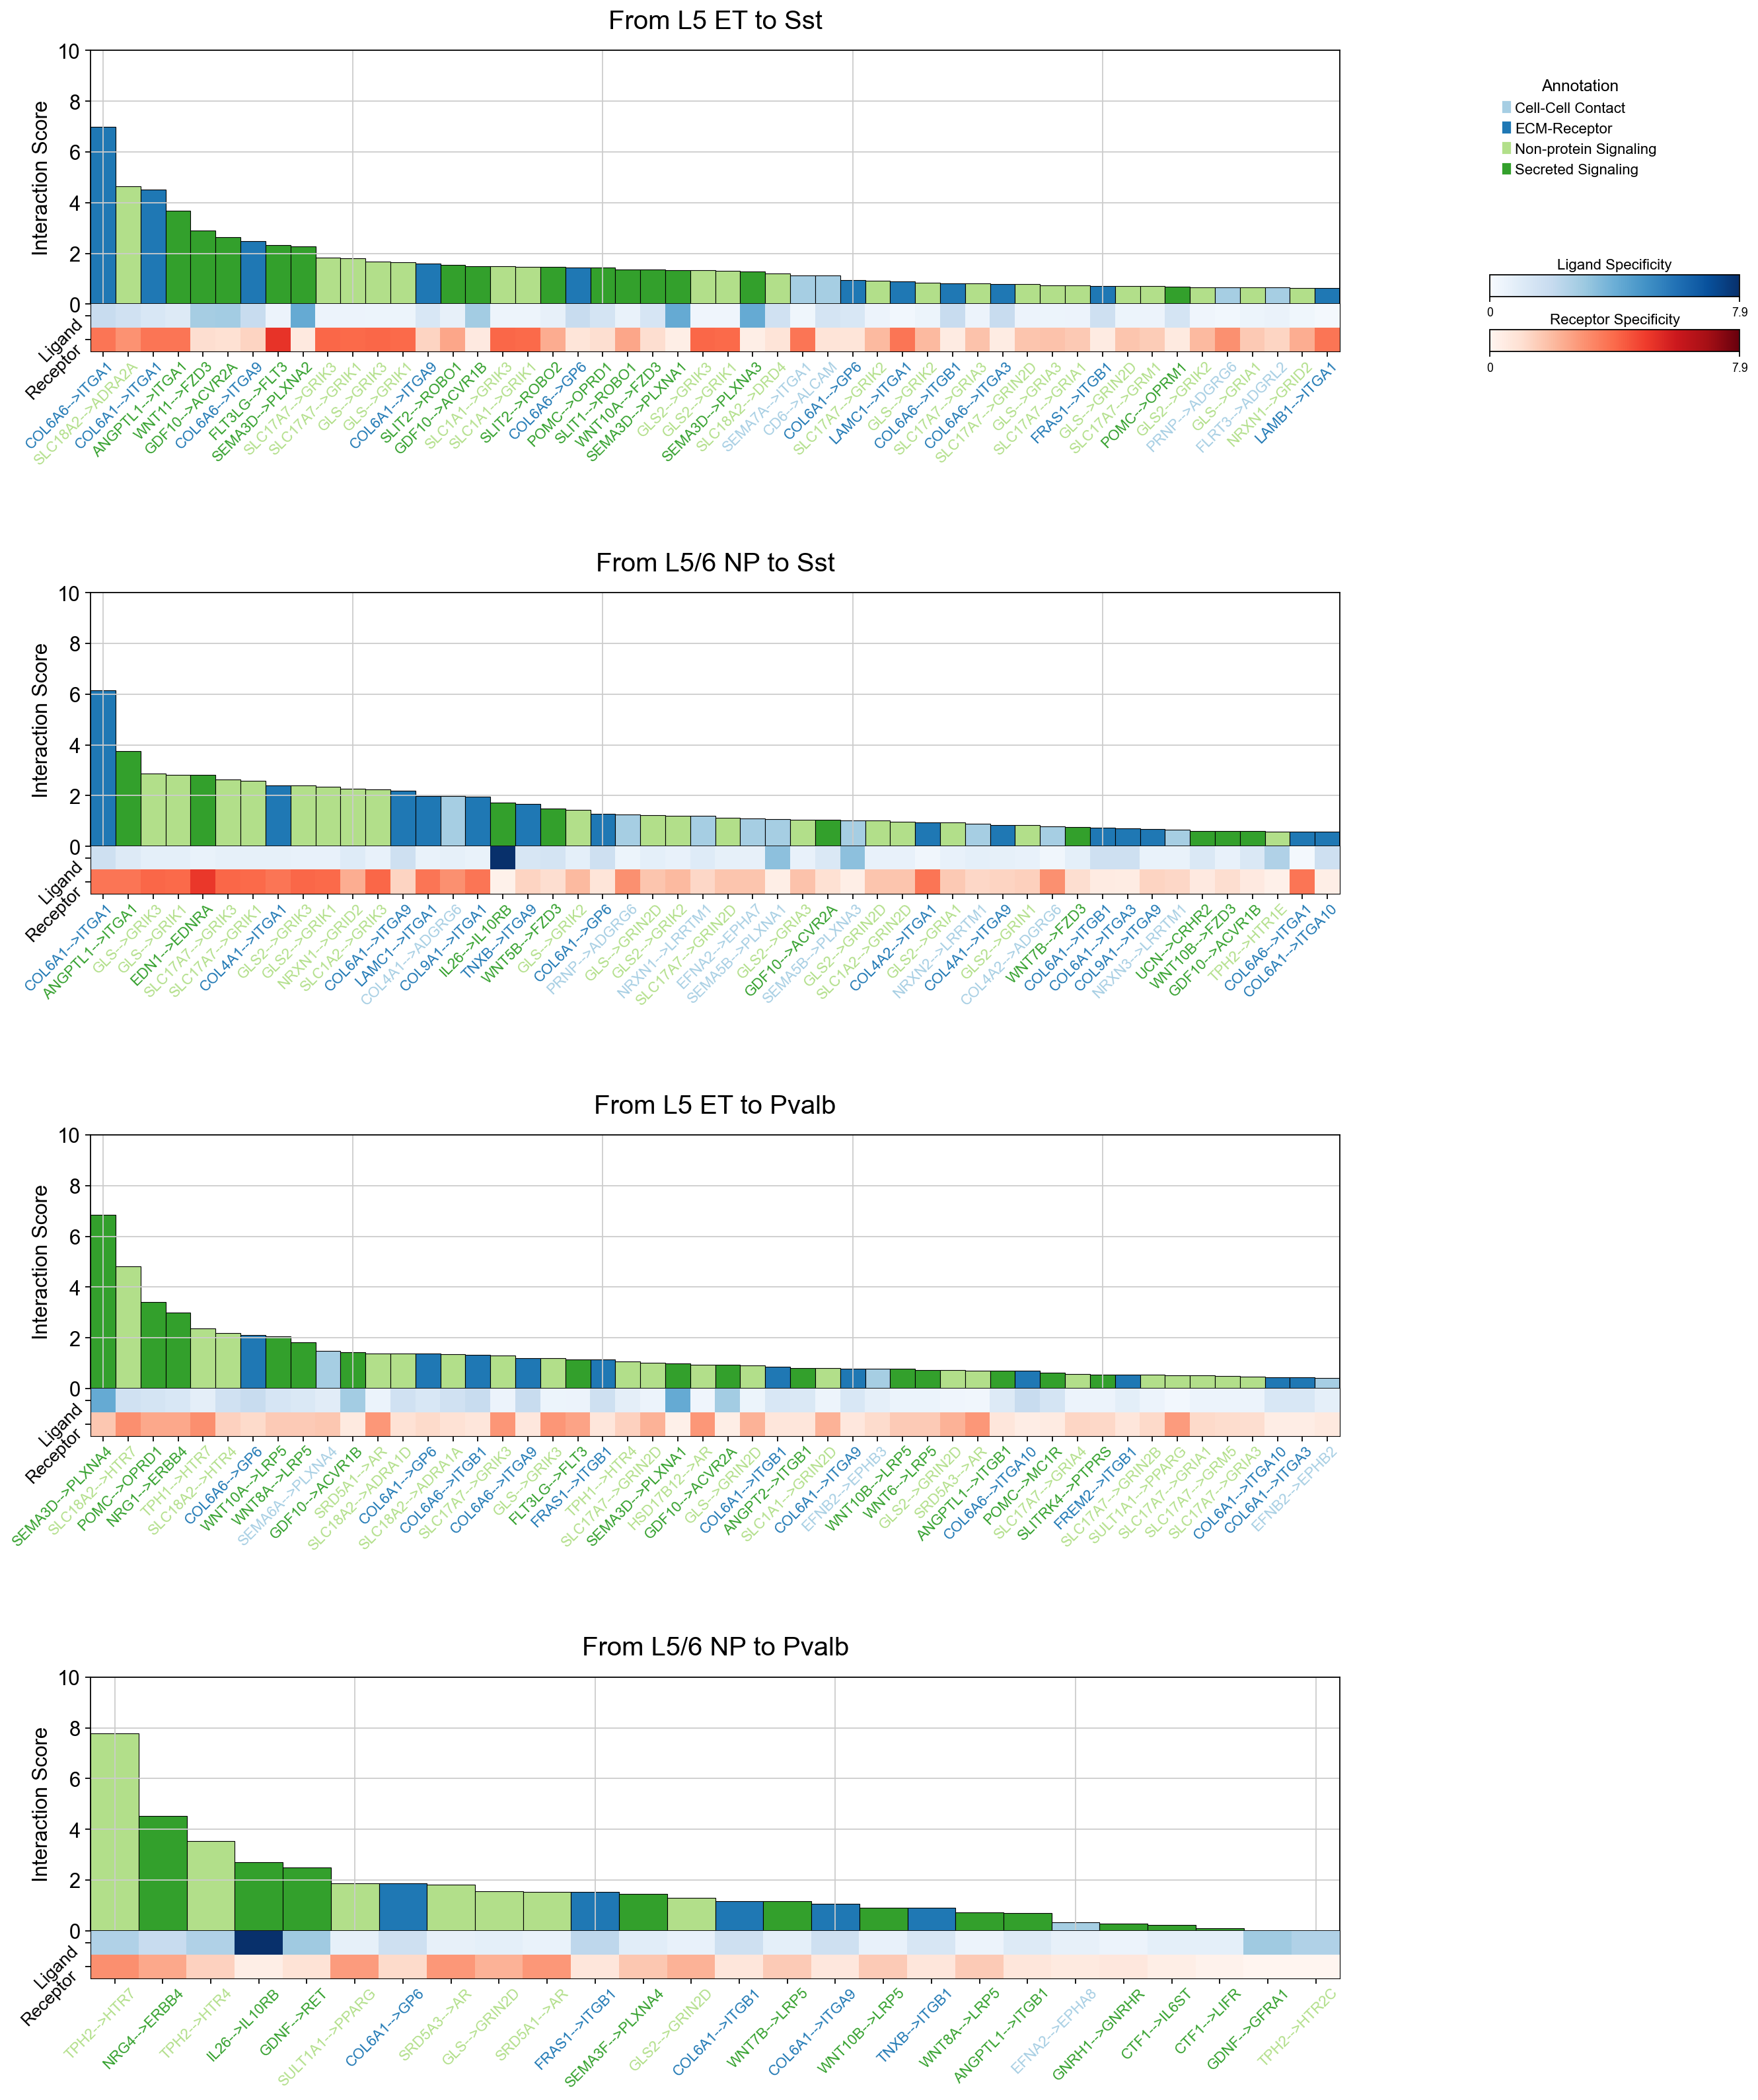
piaso.pl.plotLigandReceptorInteraction(    interactions_df=si_fdr,    specificity_df=cosg_scores,    cell_type_pairs=['L5 ET@Sst', 'L5/6 NP@Sst', 'L5 ET@Pvalb', 'L5/6 NP@Pvalb',],    ligand_receptor_sep='-->',    top_n=50,    y_max=10,    heatmap_cmap='Purples',    heatmap_cmap_ligand='Blues',    heatmap_cmap_receptor='Reds',    shared_legend=True,    vertical_layout=False,    fig_height_per_pair=6,    fig_width=20,    color_labels_by_annotation=True,
)
piaso.pl.plotLigandReceptorInteraction( interactions_df=si_fdr, specificity_df=cosg_scores, cell_type_pairs=['L5 ET@Sst', 'L5/6 NP@Sst', 'L5 ET@Pvalb', 'L5/6 NP@Pvalb',], # cell_type_pairs=['L5 NP@SST-Chrna2'], ligand_receptor_sep='-->', top_n=50, y_max=10, # heatmap_cmap='Purples', heatmap_cmap_ligand='Purples', heatmap_cmap_receptor='Reds', shared_legend=True, vertical_layout=True, fig_height_per_pair=6, fig_width=12, color_labels_by_annotation=True)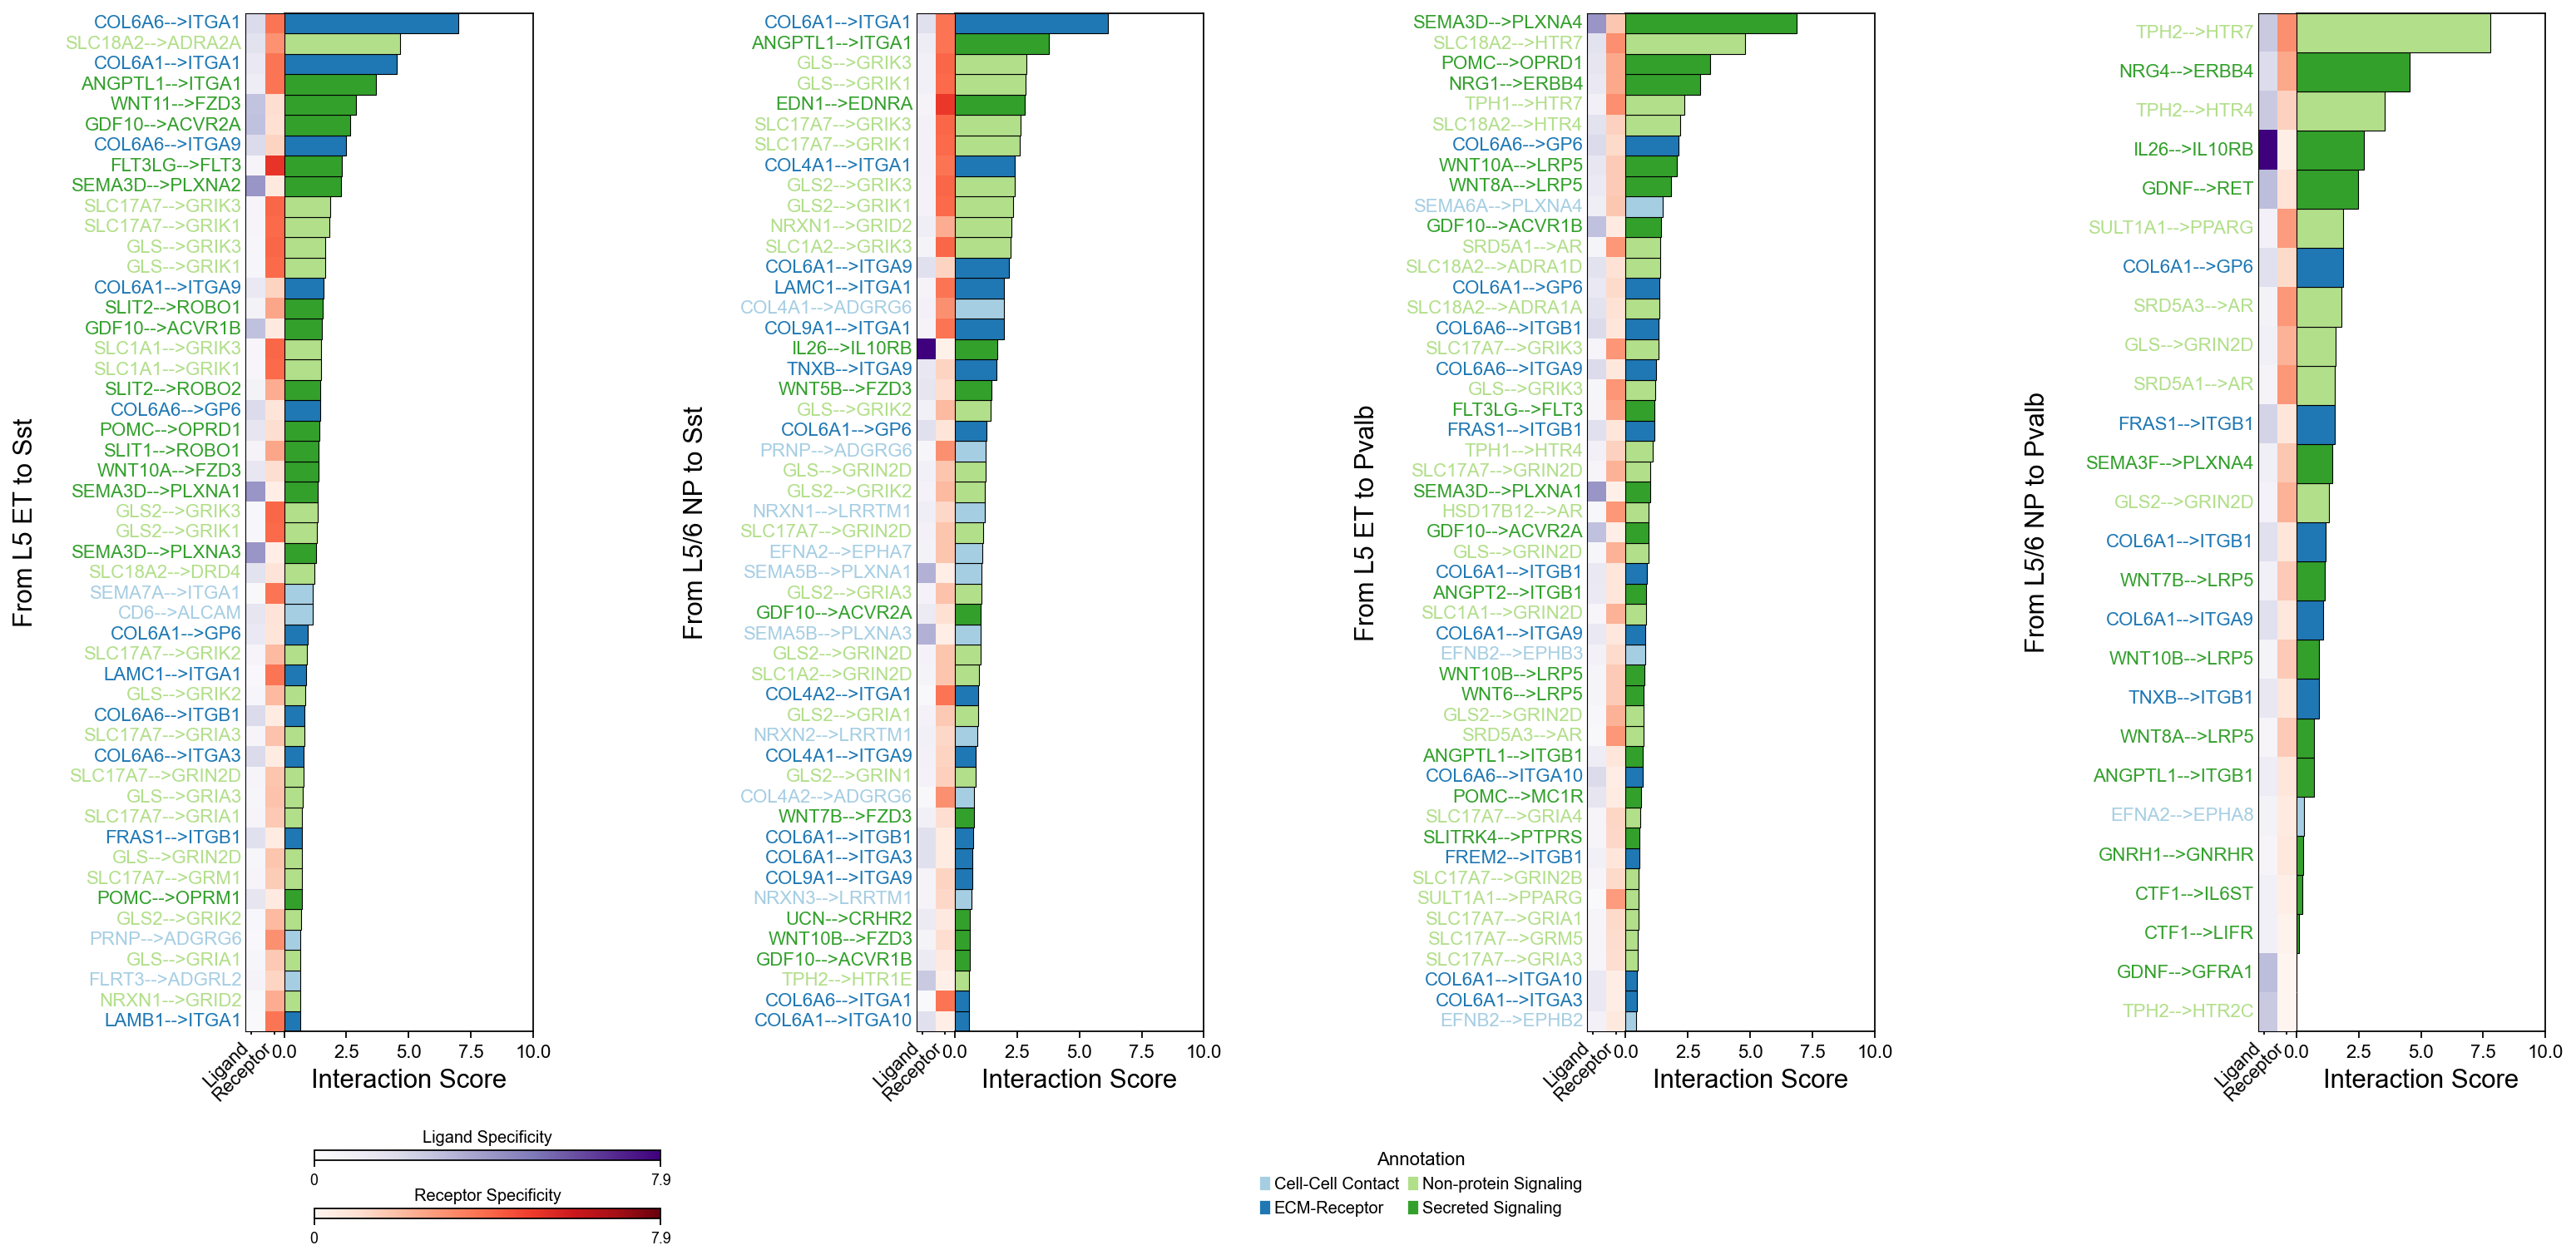
piaso.pl.plotLigandReceptorInteraction( interactions_df=si_fdr, specificity_df=cosg_scores, cell_type_pairs=['L5 ET@Sst', 'L5/6 NP@Sst', 'L5 ET@Pvalb', 'L5/6 NP@Pvalb',], cell_type_sep='@', ligand_receptor_sep='-->', top_n=50, y_max=10, # heatmap_cmap='Purples', heatmap_cmap_ligand='Blues', heatmap_cmap_receptor='Reds', barplot_palette=piaso.pl.color.d_color10, shared_legend=True, vertical_layout=False, fig_height_per_pair=6, fig_width=20, color_labels_by_annotation=True, sort_by_category=True, category_agg_method='sum')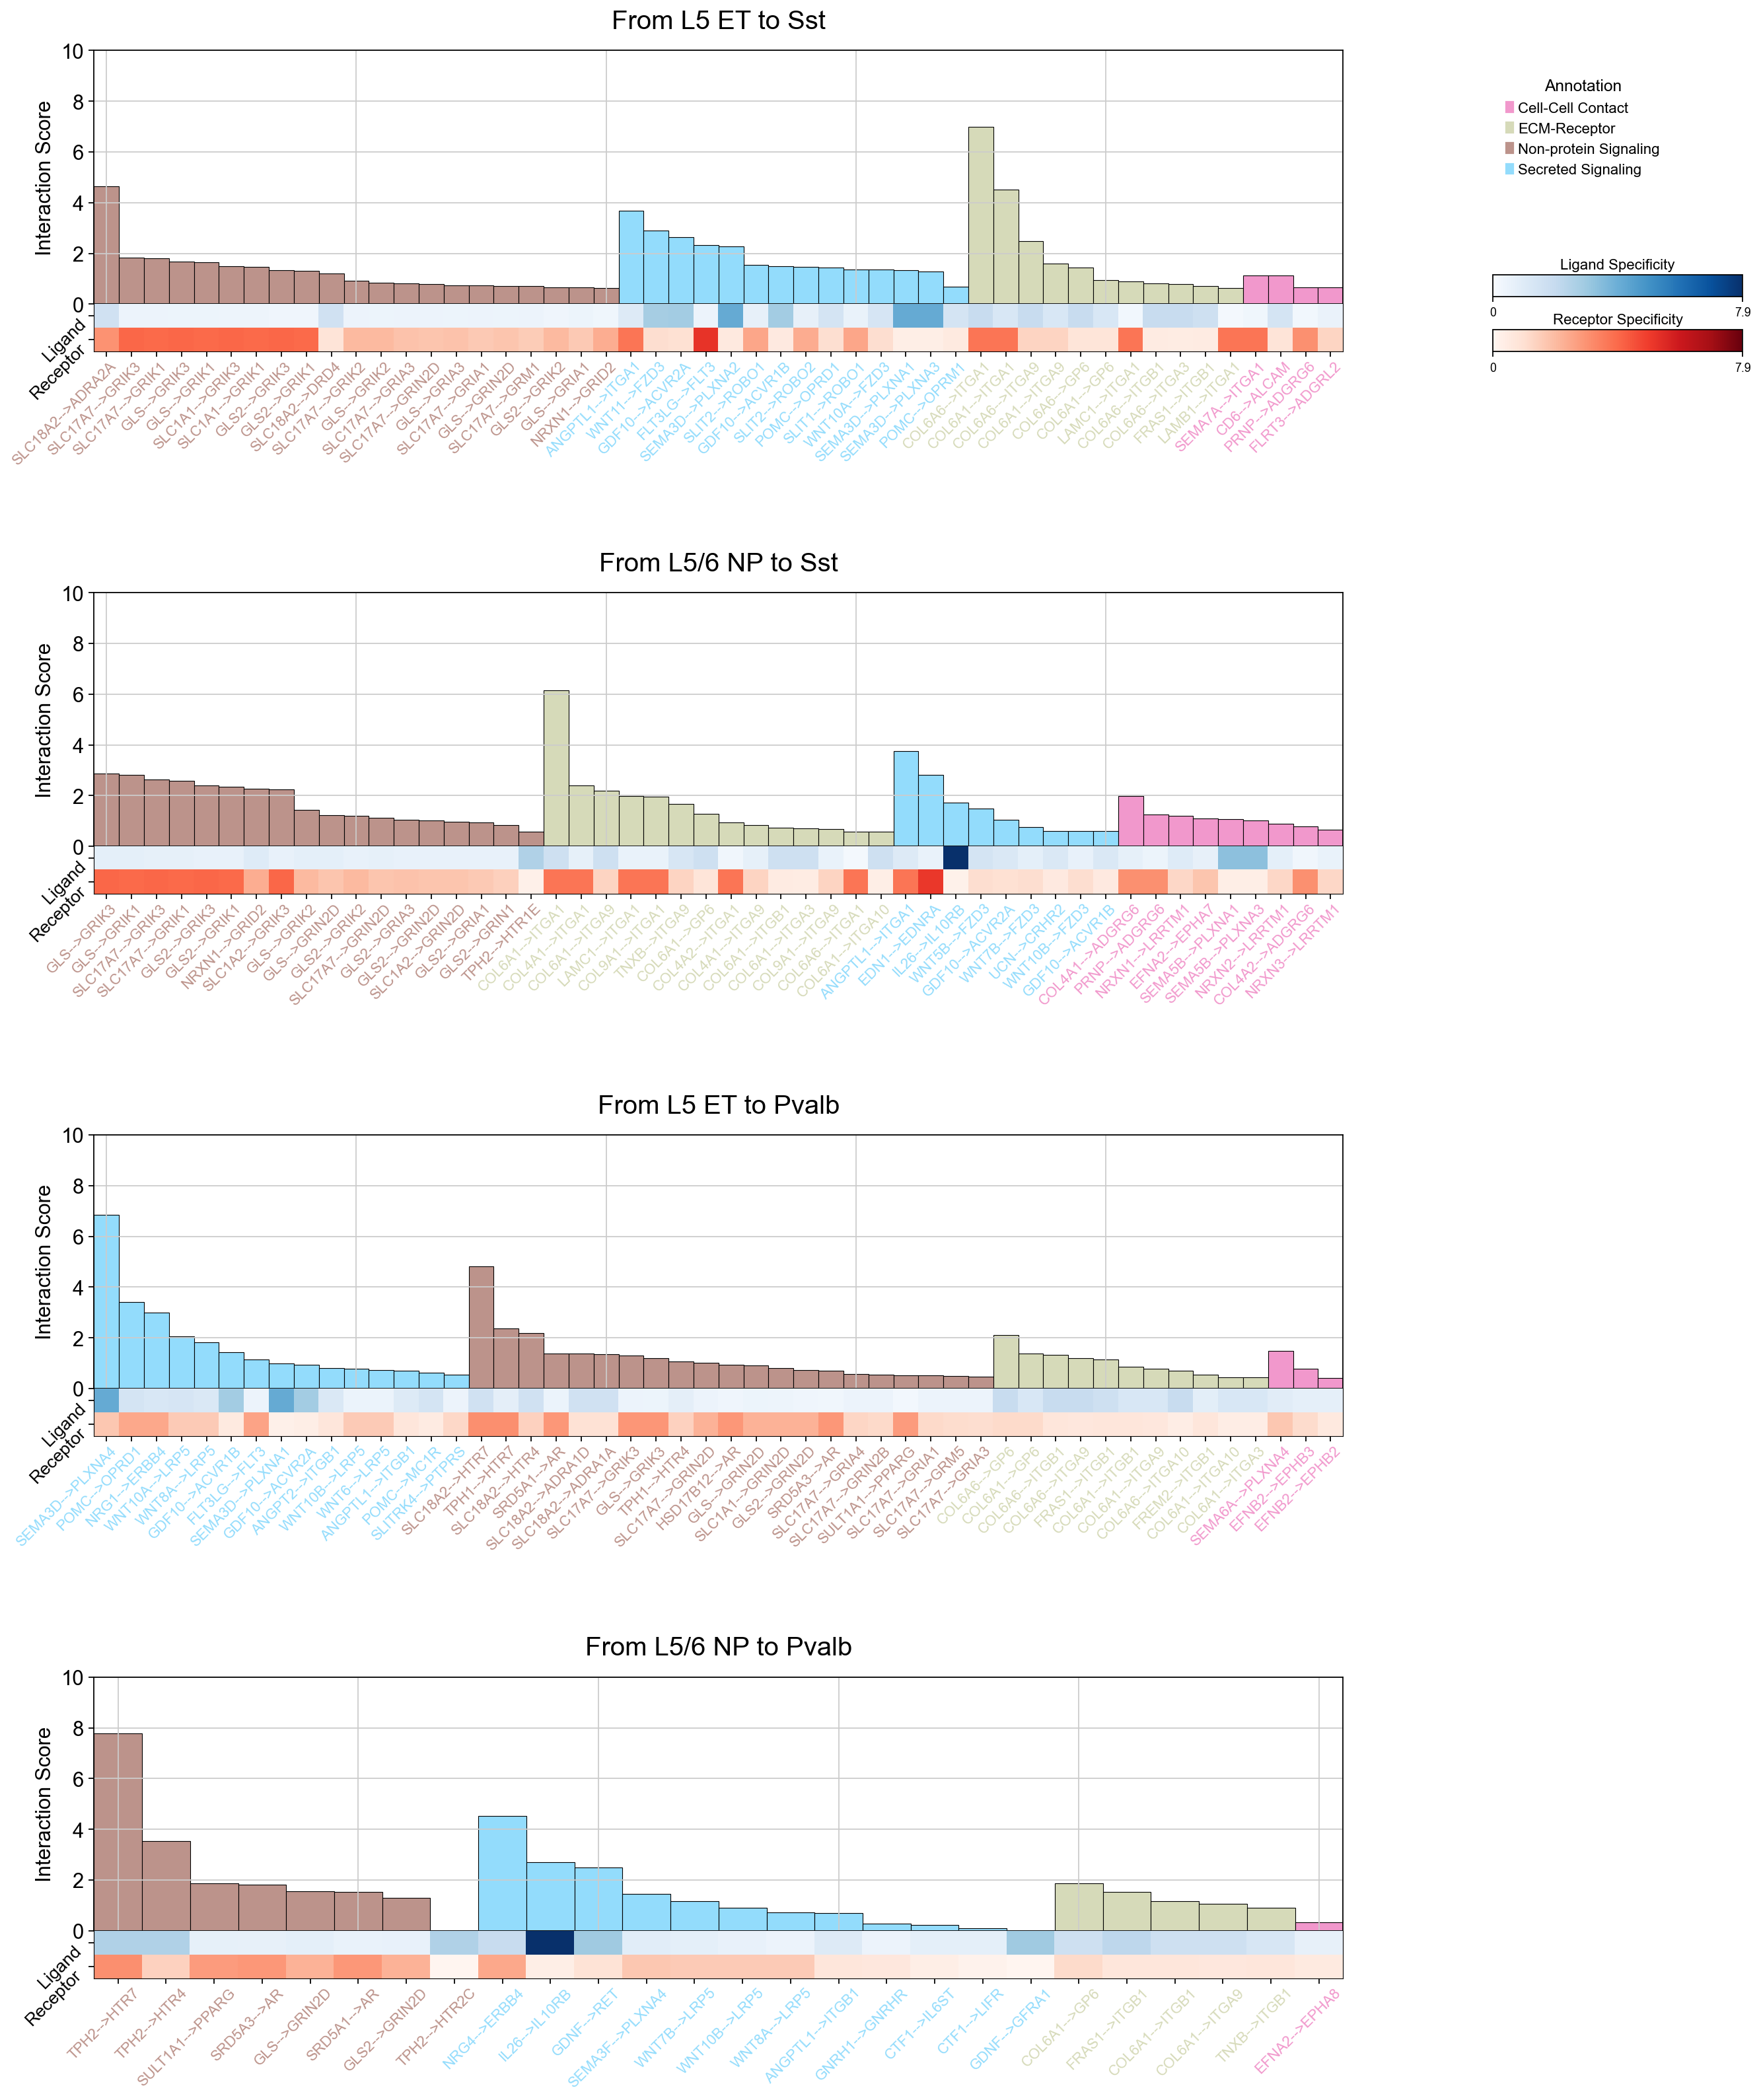
piaso.pl.plotLigandReceptorInteraction( interactions_df=si_fdr, specificity_df=cosg_scores, cell_type_pairs=['L5 ET@Sst', 'L5/6 NP@Sst', 'L5 ET@Pvalb', 'L5/6 NP@Pvalb',], # col_cell_type_pair='Category', # col_annotation= 'ConfirmedCategories', cell_type_sep='@', ligand_receptor_sep='-->', top_n=50, y_max=10, # heatmap_cmap='Purples', heatmap_cmap_ligand='Blues', heatmap_cmap_receptor='Reds', barplot_palette=piaso.pl.color.d_color10, shared_legend=True, vertical_layout=True, fig_height_per_pair=6, fig_width=12, color_labels_by_annotation=True, sort_by_category=True, # category_agg_method='sum')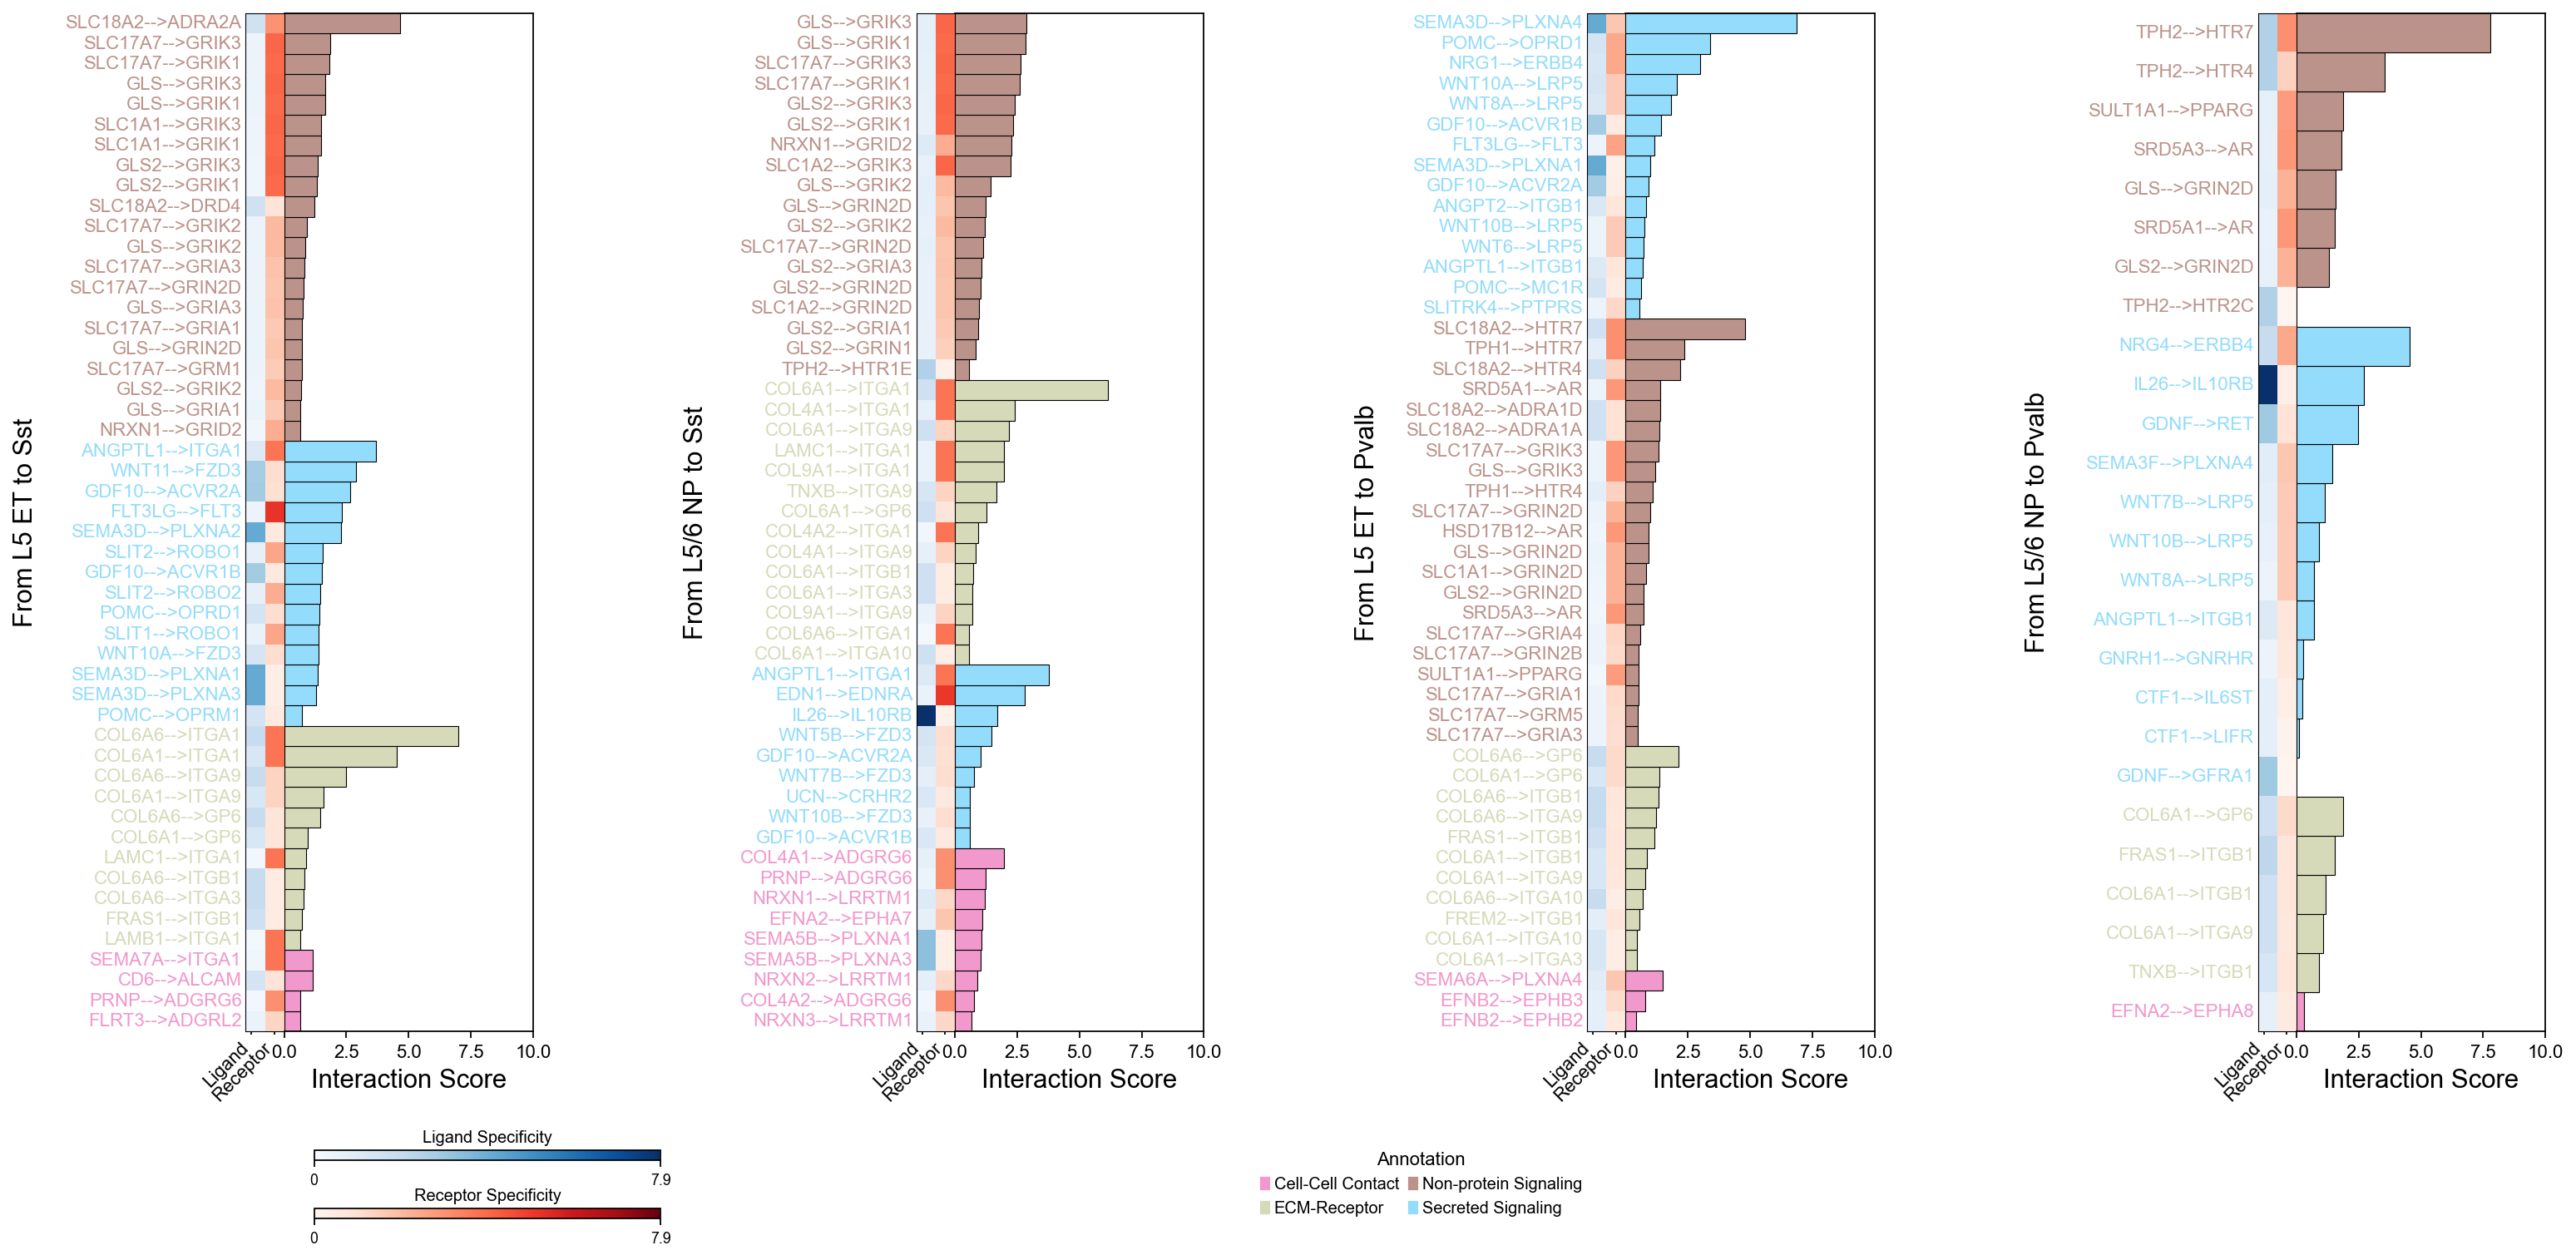
si_fdr.head()adata.obs['Subclass'].cat.categoriesIndex(['Lamp5 Lhx6', 'Lamp5', 'Pax6', 'Sncg', 'Vip', 'Sst Chodl', 'Sst', 'Pvalb', 'Chandelier', 'L2/3 IT', 'L6 IT', 'L4 IT', 'L5 IT', 'L5 ET', 'L6 CT', 'L6b', 'L6 IT Car3', 'L5/6 NP', 'Astrocyte', 'OPC', 'Oligodendrocyte', 'Endothelial', 'VLMC', 'Microglia-PVM'], dtype='object')piaso.pl.plotLigandReceptorLollipop( si_fdr, specificity_df=cosg_scores, cell_type_pairs=[ 'Microglia-PVM@L6 CT' ], top_n=50, col_cell_type_pair='CellTypeXCellType', ## Specify the cell type conlumn # col_annotation= 'annotation', sort_by_category=True, fig_height_per_pair=4, fig_width=16, vertical_layout=False, background_colors=True, # show_grid=False, logfc_range=1, ### To control the log fold chaneg range base_circle_size=30, # size_dramatic_level=1, color_labels_by_annotation=True, # score_range_max=8, score_range_min=-8, ### To control the y-axis ranges
)Warning: Column 'avg_log2FC' not found. Using default circle size.Using external specificity dataframe with 36601 genes and 24 cell types.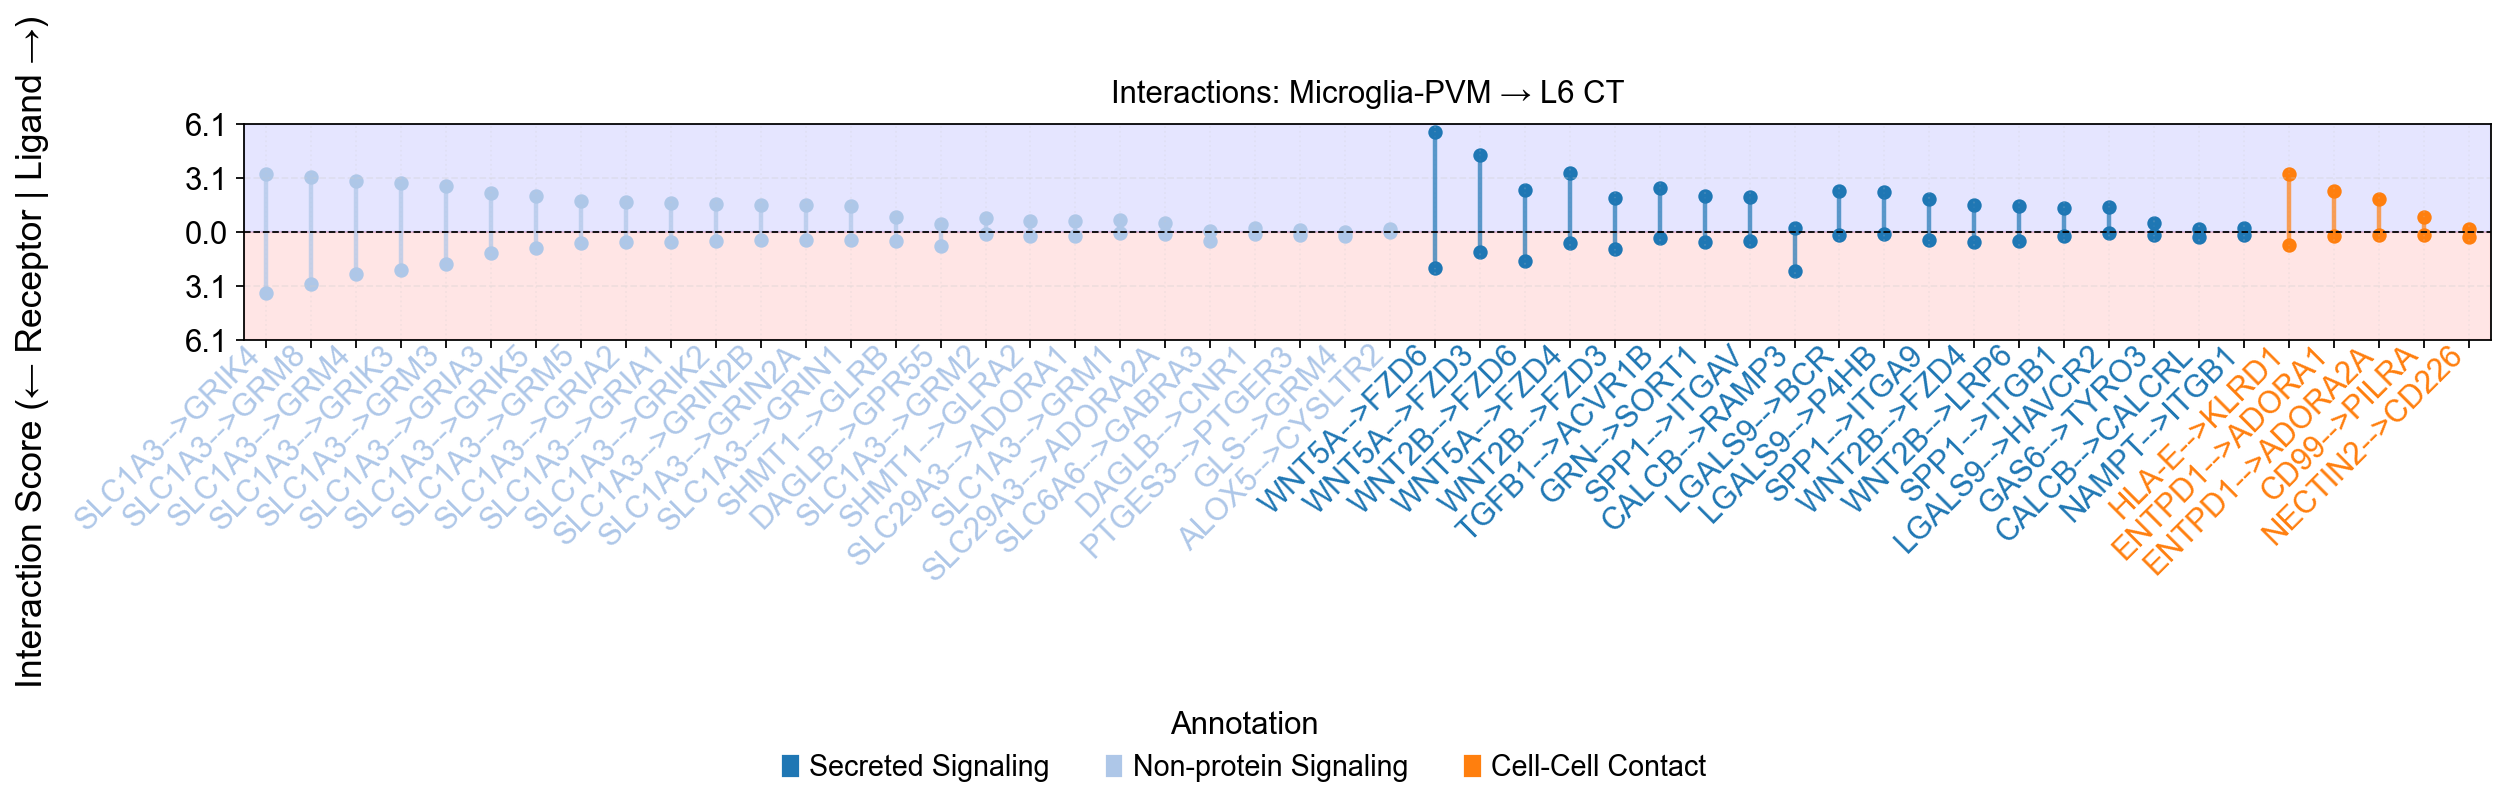
piaso.pl.plotLigandReceptorLollipop(    si_fdr,    specificity_df=cosg_scores,    cell_type_pairs=['L5 ET@Sst', 'L5/6 NP@Sst', 'L5 ET@Pvalb', 'L5/6 NP@Pvalb',                    ],    top_n=50,    col_cell_type_pair='CellTypeXCellType', ## Specify the cell type conlumn    # col_annotation= 'annotation',    sort_by_category=True,    fig_height_per_pair=4,    fig_width=16,    vertical_layout=False,    background_colors=True,    # show_grid=False,    logfc_range=1, ### To control the log fold chaneg range    base_circle_size=30,    # size_dramatic_level=1,    color_labels_by_annotation=True,    # score_range_max=8, score_range_min=-8, ### To control the y-axis ranges
)
Warning: Column 'avg_log2FC' not found. Using default circle size.Using external specificity dataframe with 36601 genes and 24 cell types.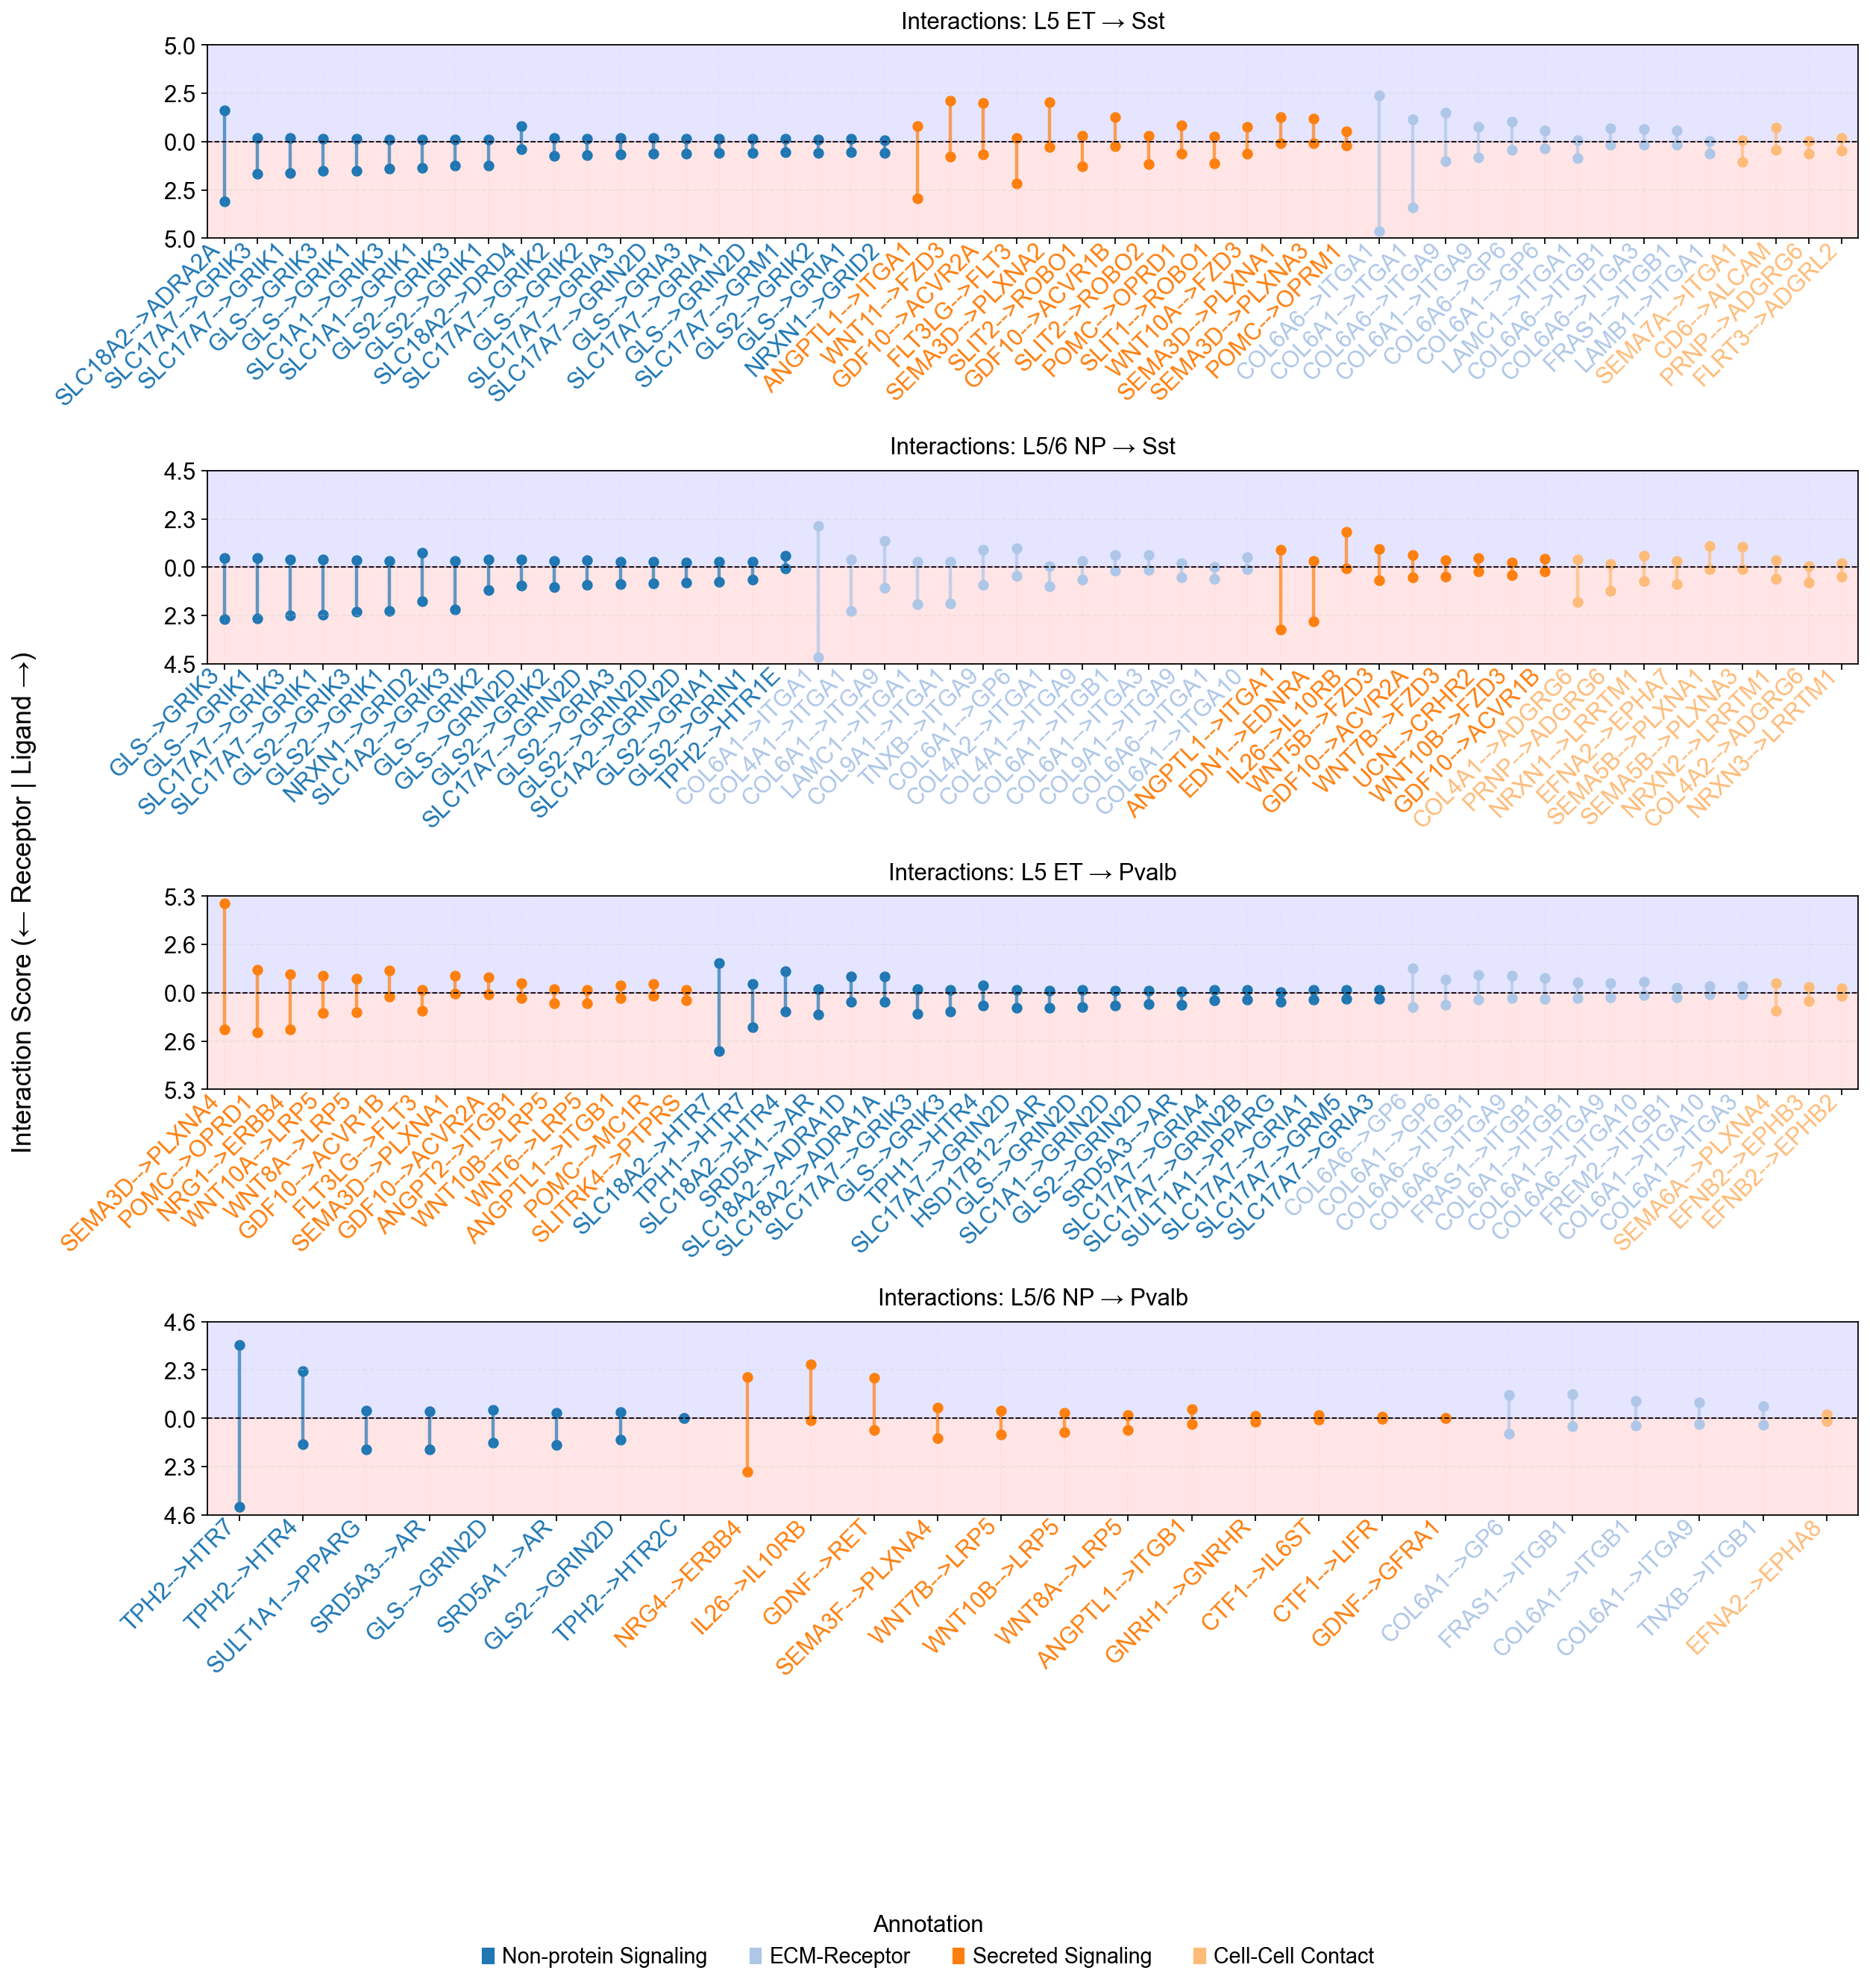
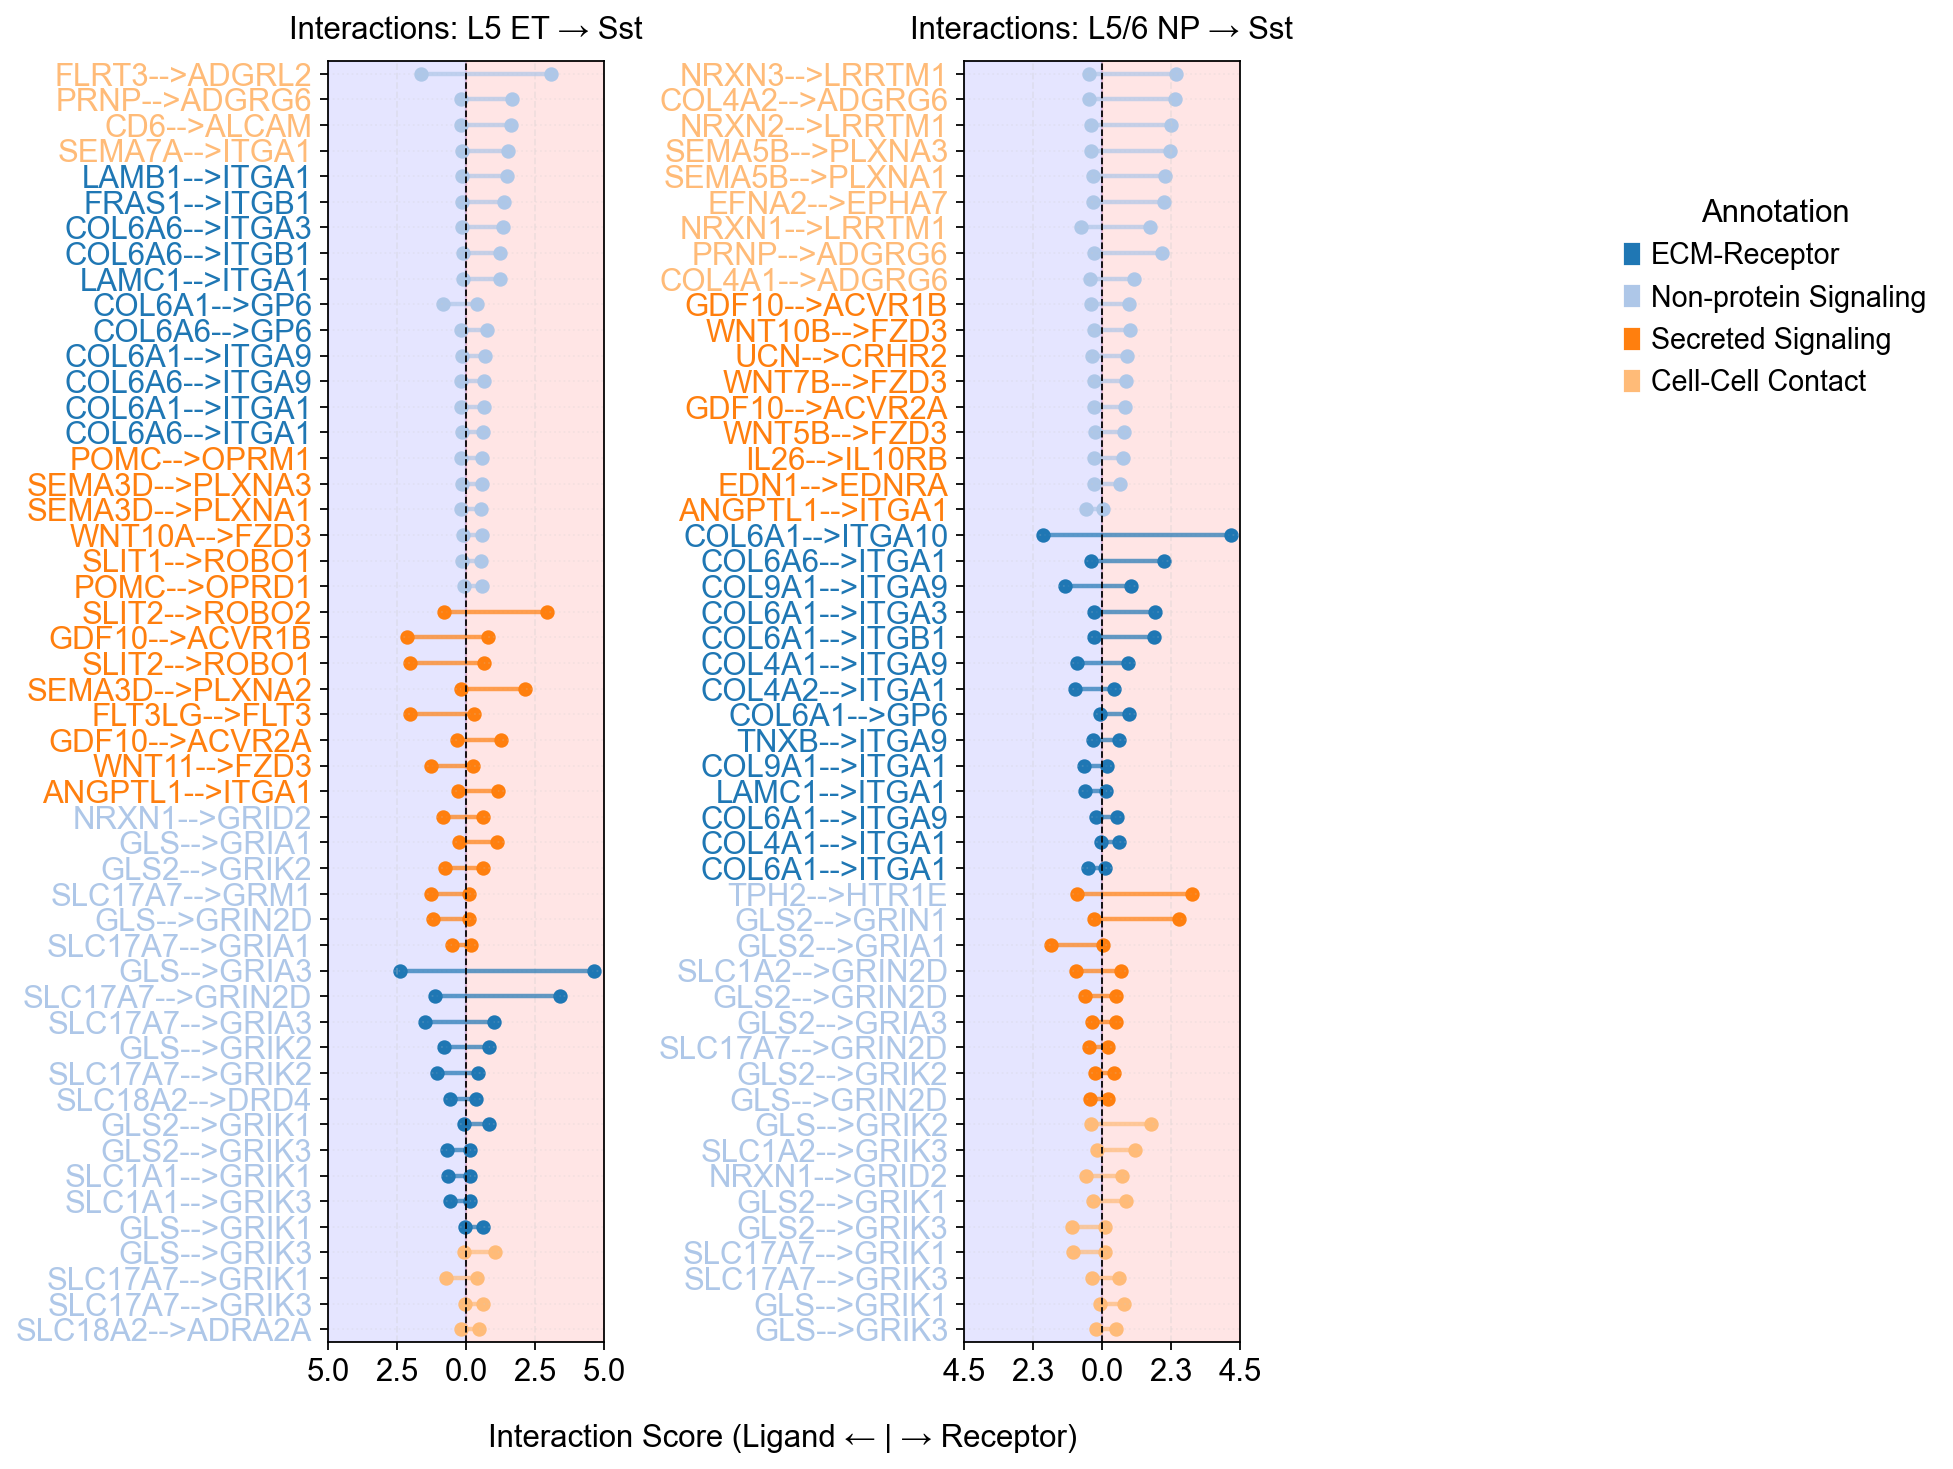
piaso.pl.plotLigandReceptorLollipop(    si_fdr,    specificity_df=cosg_scores,    cell_type_pairs=['L5 ET@Sst', 'L5/6 NP@Sst', ],    top_n=50,    col_cell_type_pair='CellTypeXCellType', ## Specify the cell type conlumn    # col_annotation= 'annotation',    sort_by_category=True,    fig_height_per_pair=10,    fig_width=5,    vertical_layout=True,    background_colors=True,    # show_grid=False,    logfc_range=1, ### To control the log fold chaneg range    base_circle_size=30,    # size_dramatic_level=1,    color_labels_by_annotation=True,    # score_range_max=8, score_range_min=-8, ### To control the y-axis ranges
)
Warning: Column 'avg_log2FC' not found. Using default circle size.Using external specificity dataframe with 36601 genes and 24 cell types.