Colour palettes
Built-in color palettes in PIASO
PIASO provides a diverse selection of discrete color palettes and continous color plattes.
To use the built-in colors in PIASO, you can set the palette=piaso.pl.color.d_color1 for the discrete colors, and cmap=piaso.pl.color.c_color1 for the continuous colors in sc.pl.umap, piaso.pl.plot_embeddings_split or other functions. This notebook aims to display the available choices in both discrete and continuous color maps.
import piasoimport piasoimport scanpy as scimport numpy as npimport matplotlib.pyplot as pltimport warningsimport piaso.plotting.color as colorpiaso.settings.set_figure_params(style="cell")from matplotlib import rcParamsrcParams['figure.figsize'] = 4, 4warnings.simplefilter(action='ignore', category=FutureWarning)Load the data
The 20k subsampled snRNA-seq data from Allen SEA-AD project is available in google drive: https://drive.google.com/file/d/1nH-CRaTQFxJ5pAVpy8_hUQn1nrIcakq2/view?usp=drive_link.
The original data is available in https://portal.brain-map.org/explore/seattle-alzheimers-disease.
adata = piaso.data.load_dataset("sea_ad_mtg_20k")adataDiscrete color palettes
palettes = [c for c in vars(color) if c.startswith('d_')]n = len(palettes)ncol = 4nrow = Nonerow_size, col_size = 2.4, 2.4if ncol is None:        nrow = int(np.sqrt(n))        ncol = int(np.ceil(n / nrow))else:    nrow = int(np.ceil(n / ncol))
fig, axs = plt.subplots(nrow, ncol, dpi=96, figsize=(ncol * col_size, nrow * row_size))
c = 0for i in range(len(axs)):    for j in range(len(axs[0])):        if c < n:            palette_value = getattr(color, palettes[c], None)
            sc.pl.embedding(adata,                            basis='X_umap',                            color=['Subclass'],                            palette=palette_value,                            cmap='Spectral_r',                            size=3,                            frameon=False,                            ax=axs[i][j],                            title='piaso.plotting.color.'+str(palettes[c]+f' - {len(getattr(color, palettes[c], None))} colors'),                            legend_loc=None,                            show=False)            axs[i][j].title.set_size(9)        else:            axs[i][j].set_visible(False)        c += 1plt.suptitle("Selection of discrete color palettes")plt.tight_layout()plt.show()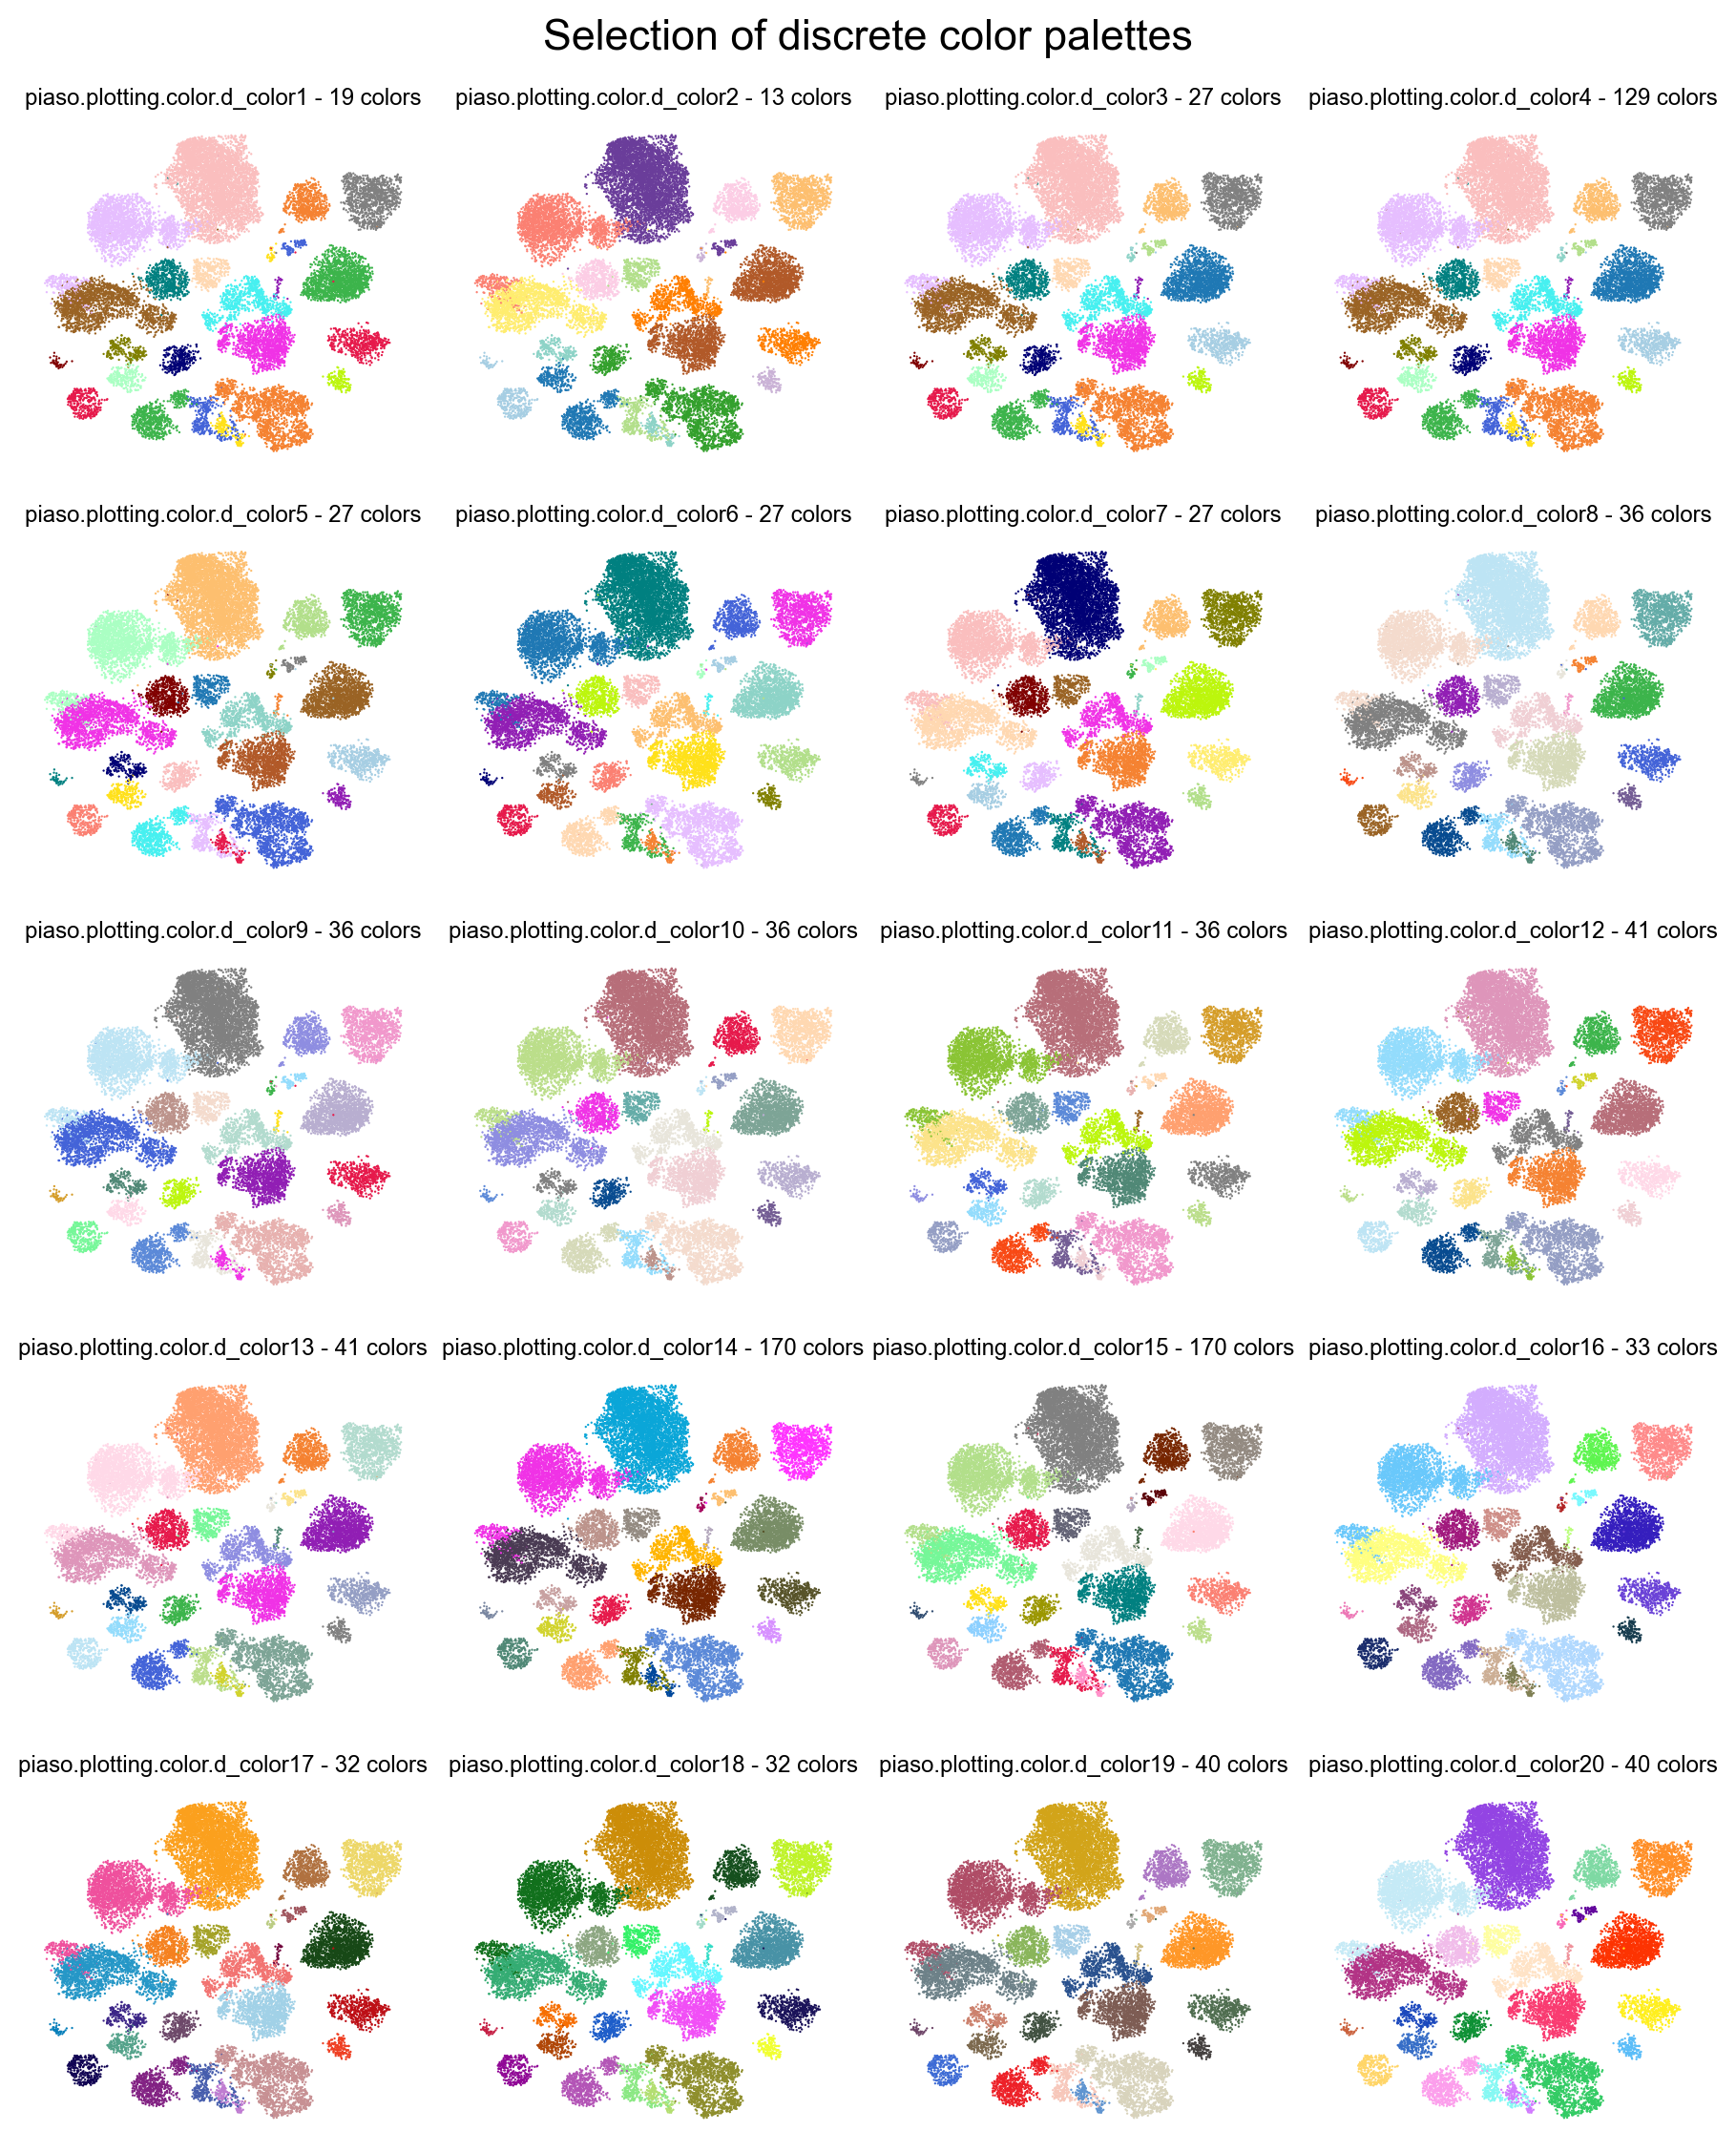
Continuous color palettes
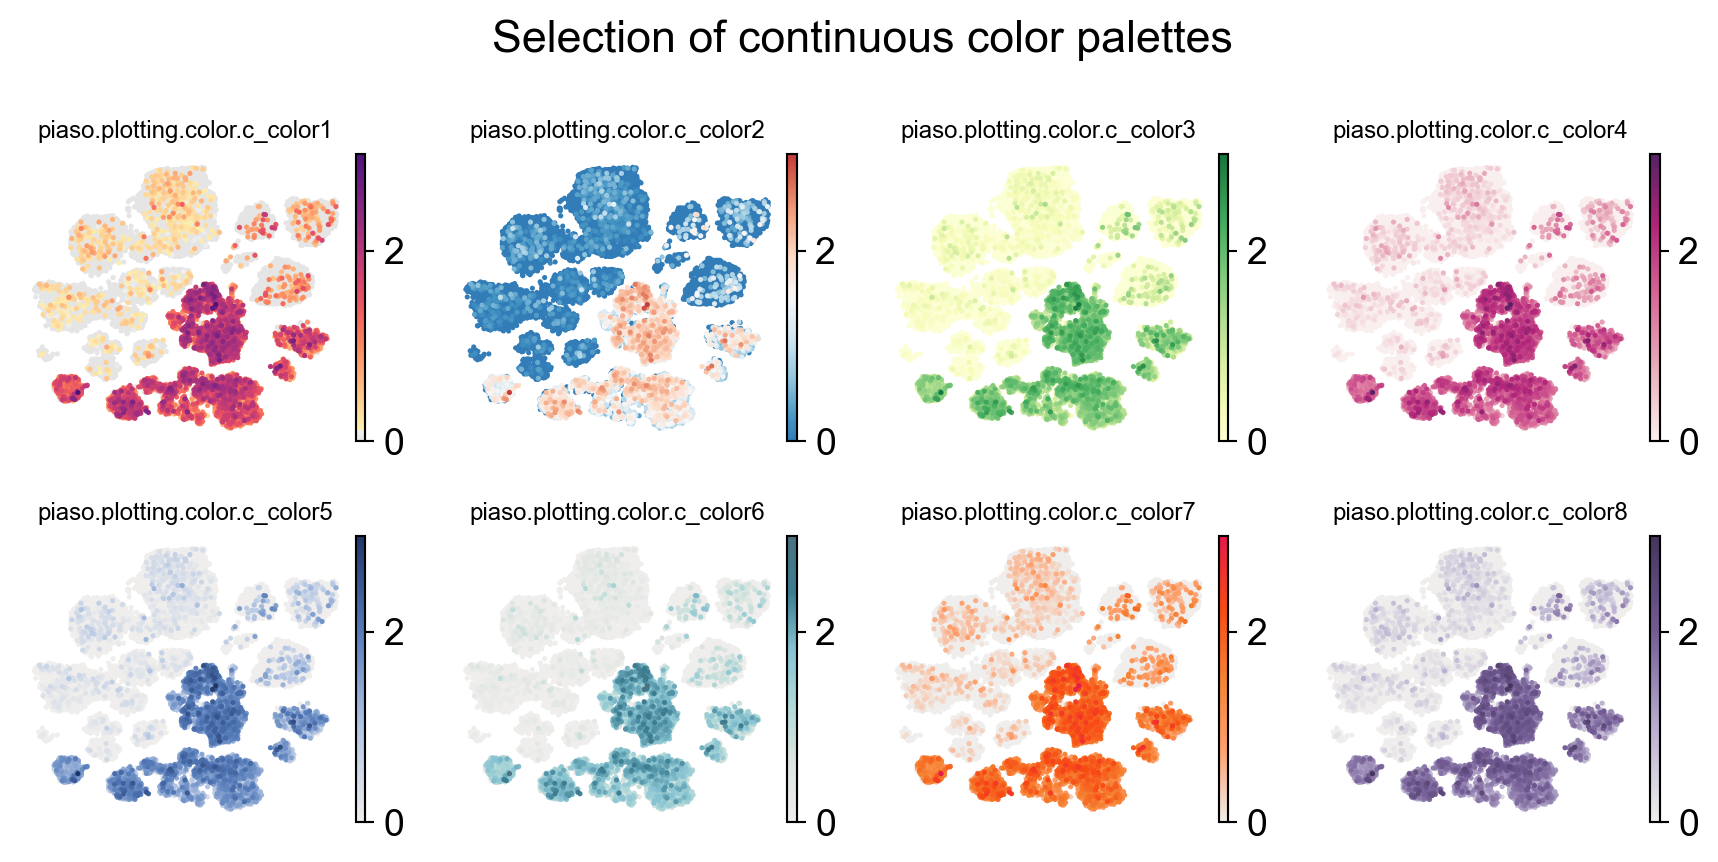
palettes = [c for c in vars(color) if c.startswith('c_')]n = len(palettes)ncol = Nonenrow = Nonerow_size, col_size = 2.3, 2.3if ncol is None:        nrow = int(np.sqrt(n))        ncol = int(np.ceil(n / nrow))else:    nrow = int(np.ceil(n / ncol))
fig, axs = plt.subplots(nrow, ncol, dpi=96, figsize=(ncol * col_size, nrow * row_size))
c = 0for i in range(len(axs)):    for j in range(len(axs[0])):        if c < n:            palette_value = getattr(color, palettes[c], None)
            sc.pl.umap(adata,                       color=['GAD1'],                       cmap=palette_value,                       size=15,                       frameon=False,                       ax=axs[i][j],                       title='piaso.plotting.color.'+str(palettes[c]),                       legend_loc=None,                       show=False)            axs[i][j].title.set_size(9)        else:            axs[i][j].set_visible(False)        c += 1plt.suptitle("Selection of continuous color palettes")plt.tight_layout()plt.show()